
Epidemiological observations as of April 17, 2020
1. On April 6, 2020, the Institute for Health Metrics and Evaluation (IHME) of the University of Washington released its revised model which can be used to predict hospital bed use, need for intensive care beds, and ventilator use due to COVID-19. The basis for projections is a pre-publication paper by the IHME COVID-19 health service utilization forecasting team led by Christopher JL Murray. Dr. Murray is the Chair and Professor of Health Metrics Sciences andDirector of the Institute for Health Metrics and Evaluation (IHME) at the University of Washington. The IHME COVID-19 paper can be downloaded from https://doi.org/10.1101/2020.03.27.20043752 To access the IHME model on-line go to https://covid19.healthdata.org/projections
2. On April 16, 2020, JAMA published a “Viewpoint” article by Nicholas P. Jewell, Ph.D. et al of the Department of Medical Statistics, London School of Hygiene & Tropical Medicine. Jewell et al cautioned against an uncritical use of models and recommended: “… the public reporting of estimates from these models, in scientific journals and especially in the media, must be appropriately circumspect and include key caveats to avoid the misinterpretation that these forecasts represent scientific truth.” Jewell et al specifically noted, “Although the Institute of HealthMetrics and Evaluation is continuously updating projections as more data become available and they adapt their methods, long-term mortality projections already have shown substantial volatility…” In my opinion, it is precisely because the IHME scientists continuously update their methodology that their model is useful. See http://www.healthdata.org/covid/updates for a discussion of the IHME updating strategy.
Jewell et al also commented: “At a time when numbers of cases and deaths from COVID-19 continue to increase with alarming speed, accurate forecasts from mathematical models are increasingly important … Given the unpredictable behavior of severe acute respiratory syndrome coronavirus 2, it is best to acknowledge that short-term projections are the most that can be expected with reasonable accuracy.” As of last week, the IHME team at the University of Washington switched to a 3-day production schedule. On April 13, 2020, the IHME model predicted a significantly worse situation for Florida than had been anticipated on April 10, 2020. The predicted peak disease activity was moved to May 6, 2020, and the IHME model predicted a total of 4,748 deaths by August 4, 2020.
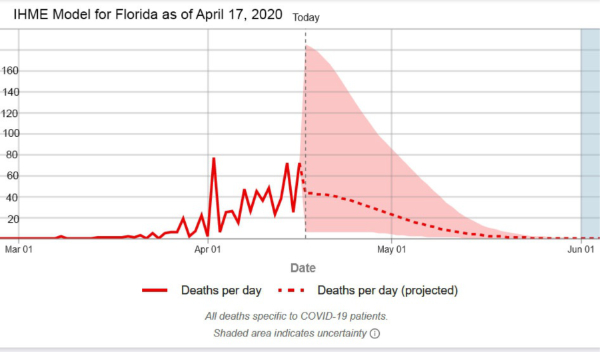
3. Based on newly available data, on April 17, 2020, the IHME model predicts a substantially better course for Florida and for the U.S. Updated analysis suggests that the peak of the COVID-19 epidemic in Florida has already occurred and will not be delayed until May 6, 2020, as previously anticipated. According to DOH data, there were 58 Florida COVID-19 deaths in the past 24 hours. The IHME model now predicts 43 (6-185) deaths on April 17, 2020, and a total of 1,363 deaths in Florida by August 4, 2020. As of today, there have already been 726 Florida deaths.
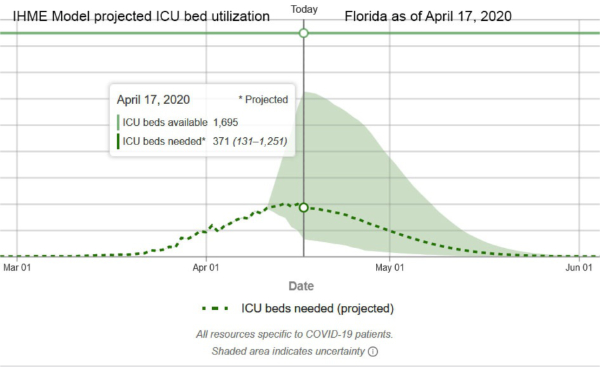
4. The IHME model estimates that 3 days have elapsed since peak hospital resource utilization in Florida. Although there may have been local shortages, the model estimates that state-wide there was no general hospital bed or ICU bed shortage. At peak utilization on April 14, 2020, ICU bed utilization for COVID-19 cases was estimated to have been 405 compared to Florida ICU bed availability of 1,695.
5. At this point in the epidemic, in descending order of severity, as determined by the number of deaths/100,000 population, the 5 hardest-hit states are New York (12,822 deaths, 66/100,000), New Jersey (3,840 deaths, 43/100,000), Connecticut (1,036 deaths, 29/100,000), Louisiana (1,213 deaths, 26/100,000), and Michigan (2,227 deaths, 22/100,000). Most other states, including the very large states of Texas (428 deaths, 1.5/100,000, and California (985 deaths, 2.5/100,000)have suffered significantly smaller losses of life per 100,000 population. Understandably, much of the media attention has been directed to the ongoing crisis in New York and New York City, but New York is not representative of the U.S. Florida is currently ranked #24 in the severity of the epidemic as the result of 726 deaths and a death rate of 3.3 per 100,000 population. For additional comparisons, see the attached Excel spreadsheet.
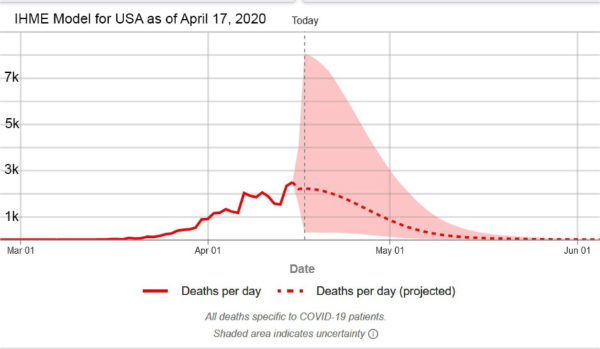
6. Updated analysis suggests that the peak of the COVID-19 epidemic in the United States has already occurred. The IHME model now predicts a total of 60,308 deaths in the United States by August 4, 2020. As of today, there have already been 32,356 U.S. deaths.
7. Epidemiological aspects of testing: At the end of March 2020, the FDA issued an emergency use authorization (EUA) for a new analyzer produced by Abbott Labs (ID NOW COVID-19). This device, which is about the size of a toaster, is expected to be used at the “point of care”, i.e. at the bedside inpatient care settings. The device detects specific nucleic acid from the RNA of the COVID-19 virus within about 5 minutes. The Abbott machine is being rapidly deployed to hospitals. At first, the test will be used primarily to confirm the diagnosis of COVID-19 in hospital emergency rooms. An even more important use will be for the determination of the presence or absence of COVID-19 in the respiratory secretions of health care providers who are either quarantined because of a supposed contact or are recovering from the disease and need to get back to the front lines of hospitals, including ICUs.
A second kind of test is a blood test to detect COVID-19 specific antibodies. In response to a viral infection, the body produces at least 2 kinds of antibodies which are immune chemicals capable of attacking outside invaders. The first type of antibody produced by the body during the early phase of infection is an IgM and the second kind of antibody which is produced during recovery and which contributes to long-lasting immunity is an IgG. Antibody tests will be valuable for at least 3 reasons: firstly, the determination of anti-COVID-19 IgG antibodies in the serum of health care workers who have recovered from COVID-19 infection will identify most (about 80%) of those workers as immune and able to treat COVID-19 patients with less risk, and possibly even without personal protective equipment (PPE); secondly, the identification of elevated levels of IgG in individuals who have recovered from COVID-19 identifies those people as potential blood donors. Anti-COVID-19 antibodies from the blood of such donors can be used to treat other patients who have severe COVID-19 infection; thirdly, the determination of IgG antibodies in large sample populations will make it possible to calculate the overall prevalence of the disease in the population, despite the fact that many who have the disease are asymptomatic.
On April 15, 2020, Abbott announced the availability, starting on April 16, 2020 of its new IgG antibody test “which will initially be available on its ARCHITECT® i1000SR and i2000SR laboratory instruments. More than 2,000 of these instruments are in use in U.S.laboratories.” Abbott plans to ship 1 million test kits for the detection of IgG this week and4 million by the end of April 2020. Abbott also announced that it is “ramping up to 20 million tests in the U.S. in June and beyond as it expands the tests to run on its new Alinity™ I system. Abbott also will be expanding its laboratory antibody testing to the detection of the antibody, IgM, in the near future.
”The current COVID-19 epidemic will be suppressed by aggressive mitigation and, in some places like New York City where there was widespread infection, the development of herd immunity. The availability of new quick and accurate testing methods will be of benefit in the control of future disease “spikes” which can be anticipated to occur after social distancing is relaxed and until an effective vaccine is available. Testing will be useful for the early detection of new disease activity, especially disease “hot spots” and for contact tracing, a traditional public health technique that involves the identification of all the contacts of an infected person and the quarantine of those contacts who are found to test positive. On April 17, 2020, JAMA published online a “Viewpoint” article by infectious disease specialists Walensky and del Rio of Harvard Medical School and Emory University School of Medicine titled “From Mitigation to Containment of the COVID-19 Pandemic Putting.” The authors emphasized the importance of testing strategies to be applied after the current acute phase of the COVID-19 epidemic has ended. Walensky and del Rio state:
The cornerstone of the next phase will require massive testing, in 2forms. First, serologic testing that detects immunoglobulins (IgM andIgG) specific for SARSCoV- 2 will provide estimates of population exposure. Because a significant number of individuals with COVID-19 are asymptomatic or mildly symptomatic, the population fraction that has been infected remains unknown. It must be presumed (and hoped) that prior exposure provides some protection, at least long enough to bridge to a vaccine. With an estimated reproduction number (R0) of 2 to 3, the benefits of herd immunity will occur when 50% to 66%of the population has already been infected, whether or not symptomatic. These population estimates could help guide the necessary level of vigilance and intervention.
In contrast to COVID-19, the R0 of measles is approximately 18. In order to stop or prevent an epidemic of measles, herd immunity of >90% must be achieved, much preferably by vaccination. Walensky and del Rio go on to explain:
Second, virologic polymerase chain reaction testing that detects active disease is important to effectively stop transmission … because asymptomatic and pre-symptomatic transmission is important, additional wide-scale intermittent testing (eg, weekly) of asymptomatic persons also may be required, particularly for individuals with significant exposure to others, such as athletes, teachers, service industry employees (eg, in retail and maintenance), and health care workers … testing alone is insufficient. Vital to any screening program is the action taken when a test result is positive. People identified with COVID-19 must be immediately informed, educated, isolated, and then their contacts efficiently identified, all in a manner sensitive to individual needs. Modeling studies suggest that to achieve effective control, contacts must be quarantined within 24 hours …
The reader should understand that in the context of epidemiology “containment” means a coordinated program of large scale testing for the detection of acute disease (e.g. analysis of nasal swab by the Abbott ID NOW COVID-19) and prompt contact tracing and quarantine of positive contacts. As explained further above, such containment will have to be applied once the nation returns to normal status in order to prevent recurrent “spikes” or even recurrent epidemics. If a disease escapes containment, mitigation is necessary. Mitigation relies on non-pharmaceutical interventions such as hand hygiene, travel restrictions, school, and business closures and social distancing which are inconvenient, socially, and economically harmful and highly effective.
Based on updated data, on April 17, 2020, the Institute for Health Metrics and Evaluation (IHME) provided the following information regarding “when US states could consider easing social distancing if containment measures are in place.” The IHME stated:
Based on our initial estimates, the earliest that some states may be able to ease presently implemented distancing policies – conditional on strong containment measures – appears to be in early to mid-May (lighter greens in the map below). This means, given the current epidemic trajectories and assuming these states have instituted robust containment strategies (e.g., widely available testing, contact tracing, and case-based isolation, restricting mass gatherings), states including Alaska, Hawaii, Idaho, Montana, New Hampshire, North Carolina, Vermont, and West Virginia could potentially fall below 1 prevalent case of COVID-19 per 1,000,000 (1 million) around the first or second week of May.
These initial projections suggest states with among the highest totalCOVID-19 deaths to date – including New York, New Jersey, and Connecticut – may be able to safely consider easing their currently enacted distancing policies, conditional on implementing strong containment strategies, as early as late May or early June. Other states, such as Louisiana, Michigan, and Washington, may fall below the 1 prevalent infection per 1,000,000 threshold around mid-May.
Based on current trajectories, 15 states may need to wait until June 8 or even beyond that time before they fall below the 1 prevalent infection per 1,000,000 threshold. These projections could change as new data become available and/or different policies are implemented.
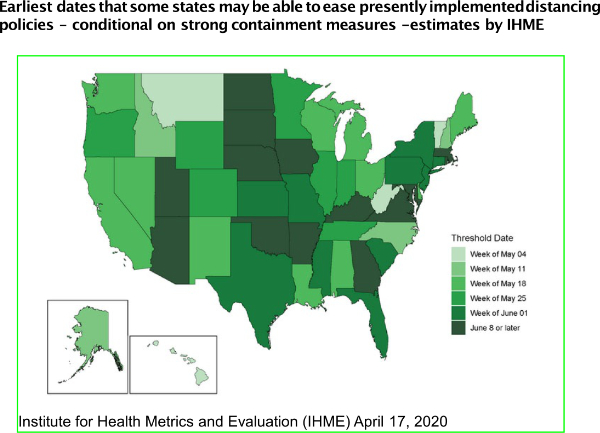
Earliest dates that some states may be able to ease presently implemented distancing policies – conditional on strong containment measures – estimates by IHME.
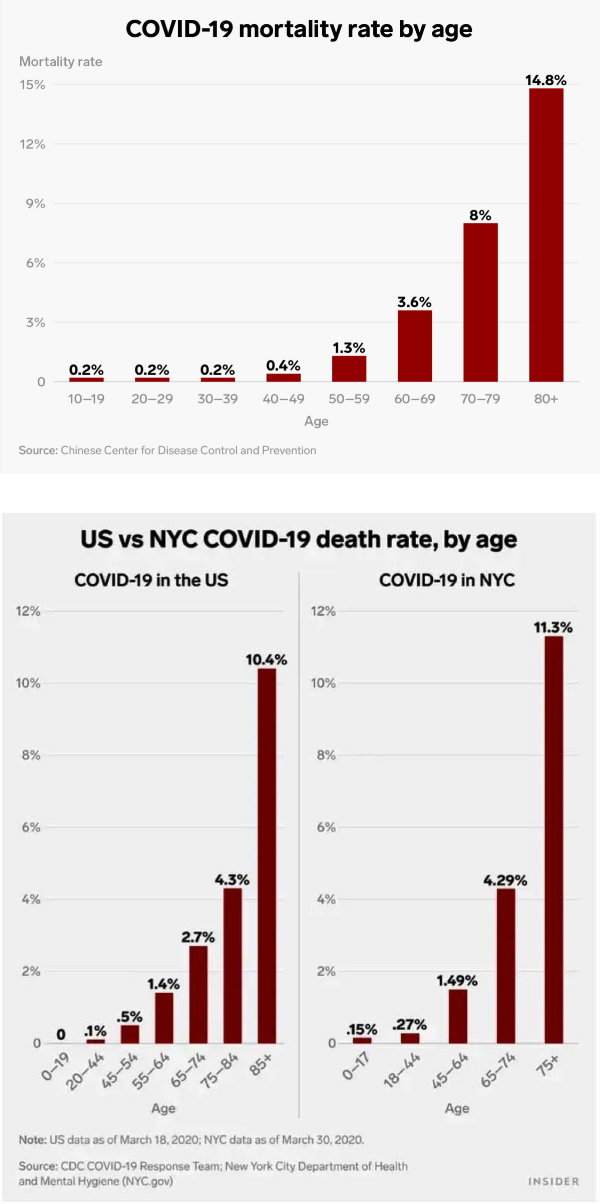
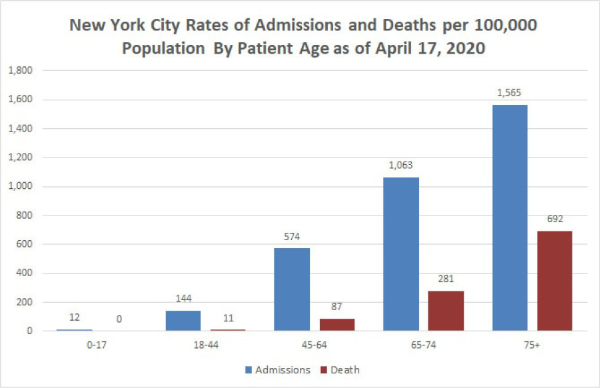
8.Additional evidence that age is a major risk factor for severity of COVID-19 illness: early in the evolution of knowledge about COVID-19 a distinct increase in risk experienced by older patients was identified in reports published by Chinese scientists. Evidence of susceptibility by age identified by the Chinese CDC and subsequently by the New York City Department of Health is shown below.
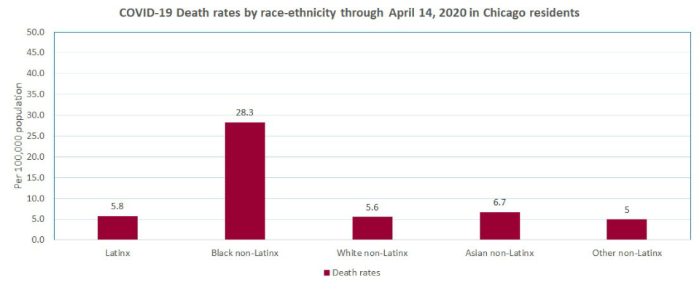
New York City residents 18-44 years old have a small but significant risk of hospital admission for COVID-19 (144/100,000) but residents 65-74 years of age have more than 7 times greater risk of hospitalization. Young New Yorkers <45 years old have a small risk of death from COVID-19(11/100,000) but older New Yorkers 65-74 have a much greater risk at 281/100,000 and residents of New York 75 and older have a risk of dying of COVID-19 approximately 63 times greater(692/11) than the risk experienced by people 18-44.
9. Underlying serious health conditions increase the risk of a severe outcome in COVID-19: The explanation for the markedly increased susceptibility of older people to this virus is still not available. One explanation that has been proposed is that with increasing age many people accumulate chronic illnesses such as obesity, hypertension, and type II diabetes which are normally manageable and not immediately threatening but which may decrease the potency of a person’s natural defenses. The Chicago Department of Health reports that as of April 10, 2020, it had identified 7,278 cases of COVID-19 and 212 deaths. Of 199 patients who died and whose medical history was available, 189 or 95% had at least one known chronic medical condition, most commonly diabetes, hypertension, and lung disease. See https://www.chicago.gov/city/en/sites/covid-19/home/latest-data.html The Department of Health of Louisiana (http://ldh.la.gov/Coronavirus/) reports the following prevalence of disease in the patients who died of COVID-19:
Hypertension: 66.4%
Diabetes: 43.52%
Kidney disease: 25.10%
Obesity. 24.70%
Heart disease: 22.67%
Asthma, which is a common chronic disease, was identified in only 4.66% of the Louisiana patients who died.
On April 3, 2020, the Morbidity and Mortality Weekly Report (MMWR) of the CDC released a special report titled “Preliminary Estimates of the Prevalence of Selected Underlying Health Conditions Among Patients with Coronavirus Disease 2019 — United States, February 12–March 28, 2020.” This report is available on-line at http://dx.doi.org/10.15585/mmwr.mm6913e2 The MMWR evaluated data on 7,162 patients and reported: “Approximately one-third of these patients (2,692, 37.6%), had at least one underlying condition or risk factor. Diabetes mellitus (784, 10.9%), chronic lung disease (656, 9.2%), and cardiovascular disease (647, 9.0%) were the most frequently reported conditions among all cases. Among 457 ICU admissions and 1,037 non-ICU hospitalizations, 358 (78%) and 732 (71%), respectively occurred among persons with one or more reported underlying health condition…. the percentage of cases that resulted in an ICU admission was also higher for those with underlying health conditions (13.3%–14.5%) than those without these conditions (2.2%–2.4%).”Of 457 patients admitted to an ICU whose prior medical history was known, the prevalence of specific diseases was:
Diabetes: 32%
Chronic lung: 21%
Heart disease: 29%
Chronic renal: 9%
Of the 457 patients who required ICU admission only 4 (1%) were pregnant.
10. Pediatric cases are uncommon, often (68%) asymptomatic and a large proportion were detected in New York: On April 6, 2020, the Morbidity and Mortality Weekly Report (MMWR) of the CDC released a special report titled “Coronavirus Disease 2019 in Children — United States, February 12–April 2, 2020. MMWR Morb Mortal Wkly Rep 2020;69:422–426.” This report is available online at http://dx.doi.org/10.15585/mmwr.mm6914e4 and its main points were summarized on April 8, 2020, by Dr. Deborah Lehman of the NEJM: “Researchers examined almost 150,000 laboratory-confirmed cases of COVID-19 between February 12 and April 2. Of these, 2572 (1.7%) were <18 years old, and 33% of pediatric cases were from New York City. For cases with available information, findings include:
a. Median age was 11 years (range, >1 to 17 years).
b. 73% of children had the classic COVID-19 symptoms (fever [56%], cough [54%],shortness of breath [13%]) versus 93% of adults.
c. Other symptoms noted in children included sore throat (24%), headache (28%), and myalgias (23%), all at lower frequencies than reported in adults.
d. Hospitalizations were lower for children (5.7%) than for adults aged 18 to 64 years (10%), including fewer intensive care unit admissions.
e. 68% of children had no symptoms (there was incomplete symptom reporting).
f. 23% of children had an underlying condition, including asthma, immunosuppression, and cardiovascular disease.”
11. Emerging evidence of increased risk for African-Americans: On April 7, 2020 media reports appeared which warned of an increased COVID-19 mortality risk experienced by African-Americans. In an article titled “The coronavirus is infecting and killing black Americans at an alarmingly high rate” the Washington Post reported:
In Milwaukee County, home to Wisconsin’s largest city, African Americans account for about 70 percent of the dead but just 26 percent of the population. The disparity is similar in Louisiana, where 70 percent of the people who have died were black, although African Americans make up just 32 percent of the state’s population.
In Michigan, where the state’s 845 reported deaths outrank all but NewYork’s and New Jersey’s, African Americans account for 33 percent of cases and roughly 40 percent of deaths, despite comprising only 14percent of the population. The state does not offer a breakdown of race by county or city, but more than a quarter of deaths occurred in Detroit, where African Americans make up 79 percent of the population.
And in Illinois, a disparity nearly identical to Michigan’s exists at the state level, but the picture becomes far starker when looking at data just from Chicago, where black residents have died at a rate six times that of white residents. Of the city’s 118 reported deaths, nearly 70 percent were black— a share 40 points greater than the percentage of African Americans living in Chicago.
The Chicago Department of Health at https://www.chicago.gov/city/en/sites/covid-19/home/latest-data.html and the City of Chicago at https://datausa.io/profile/geo/chicago-il#demographics provide the information that I used to prepare the following charts:
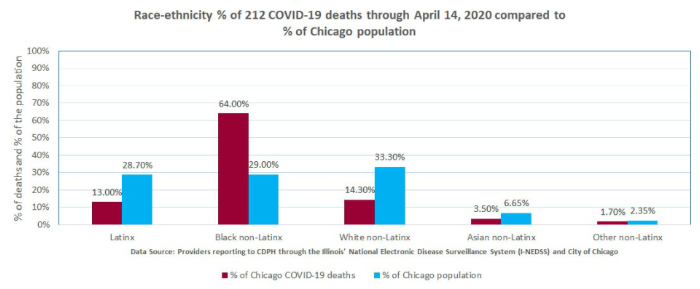
The explanation for the reported increased susceptibility of African Americans to this virus is still not available but it has been suggested that it is due to the higher prevalence of certain chronic diseases such as hypertension and diabetes in the African American population. As noted above, the Chicago Department of Health reported that 94.5% of patients who died of COVID-19 had at least one known chronic medical condition, most commonly diabetes, hypertension, and lung disease.
Notes:
1. Values in columns above which show the theoretical number of cases, prevalence, and mortality at“x10” estimate that the real number of cases is 10x greater than the reported number of test-proven cases. The actual number of cases is probably between 10 and 100 times greater than the number of test-proven cases. Mortality rates are calculated by dividing the number of deaths by the number of confirmed (tested) cases which are mostly severe or moderately severe cases. It is too early to estimate the mortality of hospitalized patients. Verity et al reported in LancetInfect Dis (https://doi.org/10.1016/S1473-3099(20)30243-7): mean duration from onset of symptoms to death 17.8 days; also “In all laboratory-confirmed and clinically diagnosed cases from mainland China (n=70,117)… we obtained a best estimate of the case fatality ratio in China of 1.38% (1.23-1.53), with substantially higher ratios in older age groups…”
2. For context: CDC reports that in 2017 total of U.S. deaths from all causes was 2,813,503.
3. Compare to influenza. United States CDC reports:2018-2019 influenza: 35,520,883 cases, 490,561 hospitalizations and 34,157 deaths.Overall mortality of 34,157/35,520,883 = .1% and hospital mortality 34,157/490,561 = 7%
2017-2018 influenza: 45,000,000 cases,810,000 hospitalizations and 61,000 deaths.Overall mortality of 61,000/45,000,000 = .14% and hospital mortality 61,000/810,000 =7.5%