Epidemiological observations on COVID-19 as of May 18, 2020
What is new in today’s narrative report:
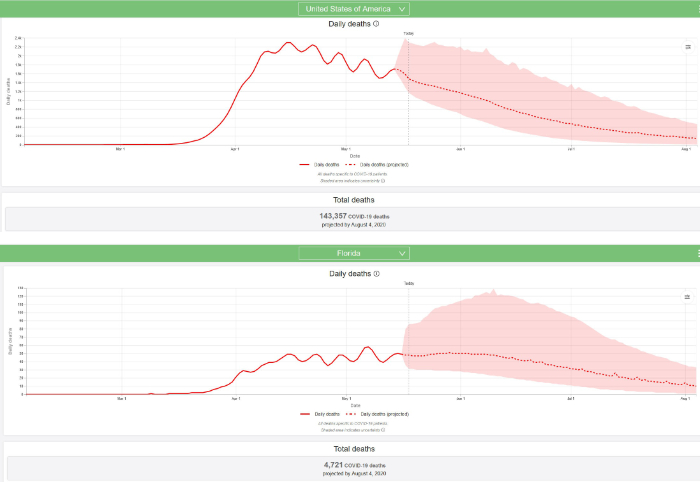
a. Section 1: Results of May 18, 2020, Institute for Health Metrics and Evaluation (IHME) model run: IHME predicts that a total of 143,357 Americans, including 4,721 Floridians will die of COVID-19 by August 4, 2020 (revised downward from the May 10, 2020 model run which predicted deaths of 147,040 Americans, including 5,819 Floridians).
b. Section 2: as most states move to reduce social isolation (“shelter in place”) and social distancing, it is important to note the IHME’s warning, issued May 10, 2020:
Unless concerted efforts to accelerate testing and other key containment strategies take place (e.g., contact tracing and case-based isolation, widespread use of masks in public), there could be elevated risk for exposure to the novel coronavirus (SARS-CoV-2) and thus transmission among communities, or even resurgence of COVID-19 infections and mortality.
As previously stated, we have little confidence in the value of widespread testing, except for special populations and little confidence in the efficacy of contact tracing, but we do believe in the great potential benefit of the use of masks/shields both for the reduction of droplet dispersion from an infected person and for the reduction of the risk of infection to a non-infected person. We plan to show in a brief communication to be submitted for publication, and in an upcoming narrative report, that as a practical matter, widespread use of masks for indoor public interactions will be of great value. Therefore, wear a mask when you are inside in a public place (work, shopping, airport). If you are older than 60, wear a mask and a shield.
c. Section 3: Pediatric cases of COVID-19 and Multisystem Inflammatory Syndrome in Children (MIS-C) Associated with Coronavirus Disease 2019 (COVID-19) – HEALTH ADVISORY OF THE CDC.
1. On May 4, 2020, the Institute for Health Metrics and Evaluation (IHME) of the University of Washington described important changes in its modeling methodology and strategy which will greatly enhance the accuracy and utility of its results. On May 18, 2020, the IHME released the results of the 3rd run of its new model. On its website, the IHME provides a detailed explanation of its revised approach which is summarized below. The reader is encouraged to go to the IHME Update Page at http://www.healthdata.org/covid/updates
Governments, community leaders, physicians, hospital administrators, and individuals should monitor the new IHME findings and predictions as they are released.
The new IHME model will undoubtedly provide much more accurate predictions than were available from prior models. On May 10, 2020, the IHME stated:
Our May 4 release involved major updates to IHME’s broader COVID-19 estimation framework, and thus major updates to our COVID-19 projections in the US. In addition to improving our deaths model, we introduced a transmission dynamics component to our broader modeling strategy, enabling us to quantify the rates at which individuals move from susceptible to exposed, then infected and recovered (known as SEIR). By implementing our multi-stage hybrid model for all 50 states and the District of Columbia, we then could quantify the potential effects of changing drivers of virus transmission (e.g., temperature, testing, mobility) and incorporate these statistical relationships into COVID-19 death and infection projections.
Since our last release, we have been able to include a week’s worth of new data for the US – not only for daily reports of COVID-19 deaths and infections, but also for key factors in state-level epidemic trajectories such as mobility, easing or formal plans to ease social distancing policies, and testing rates. And since trends or patterns in each of these factors are evolving at a different pace by state, they are in turn having different effects on state-level COVID-19 predictions.
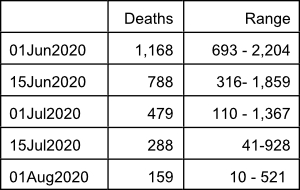
On May 18, 2020, the IHME predicted that a total of 143,357 Americans, including 4,721 Floridians will die of COVID-19 by August 4, 2020 (revised downward from the May 10, 2020 model run which predicted deaths of 147,040 Americans, including 5,819 Floridians by August 4, 2020). In addition, the May 18, 2020 IHME report indicates that the epidemic, although becoming less intense, will certainly continue to have a major impact worldwide and in many parts of the United States until the fall of 2020 and possibly until 2021. The current model predicts the following number of deaths in the United States on specific dates:
The reader is encouraged to go to the IHME online interactive visualization page at https://covid19.healthdata.org/projections
The IHME graphical summaries for the USA and Florida on May 18, 2020 are reproduced below.
Summary of updated IHME COVID-19 multi-stage hybrid model. On May 4, 2020, the IHME described their new modeling and prediction strategy:
“This modeling approach involves estimating COVID-19 deaths and infections, as well as viral transmission, in multiple stages. It leverages a hybrid modeling approach through its statistical component (deaths model), a new component quantifying the rates at which individuals move from being susceptible to exposed, then infected, and then recovered (known as SEIR), and the existing microsimulation component that estimates hospitalizations. We have built this modeling platform to allow for regular data updates and to be flexible enough to incorporate new types of covariates as they become available. Last, by relating transmission parameters to predictions of key drivers of COVID-19 epidemic trends – temperature, the percentage of populations living in dense areas, testing per capita, and human mobility – this new modeling approach will allow for a more comprehensive examination of how COVID-19’s toll could unfold in the coming months, taking into account these underlying drivers. This is particularly important as many locations ease or end prior distancing policies without having a clear sense of how these actions could potentially affect COVID-19 trajectories given current trends in testing and mobility, among others.”
Part 1 of new IHME strategy: Estimating COVID-19 deaths
“Smoother daily death trends as model inputs … As of today’s release, we now apply this algorithm 10 times in a row, which smooths daily death trends for a longer period of time. This approach allows the death model to be better informed by the overall time trend and less sensitive to daily fluctuations.
“Hospitalizations of COVID-19 patients as an additional leading indicator for estimating COVID-19 deaths in the next eight days.
“Correcting reported cases to account for scaling up testing. As more locations scale-up testing for COVID-19, many places may report increases in cases; however, such increases usually reflect an increased detection of existing cases rather than a true rise in COVID-19 infections. Where data are available, we aim to adjust trends in reported cases based on the relationships between testing per capita and test positivity rates. To date, we have found as testing rates double, cases increase by an average of 22%. We then use this relationship to adjust case trends which then inform our death models, a vital step toward ensuring a more accurate representation of COVID-19 epidemic trends. Other COVID-19 estimation updates do not appear to account for this relationship between reported cases and expanded testing efforts; this could lead to very different conclusions about future epidemic trends.
“Expanding the range of multi-Gaussian distribution weights for predicting epidemic peaks and shapes … This expansion now allows for longer epidemic peaks and tails, such that daily COVID-19 deaths are not predicted to fall as steeply as in previous releases.
“Incorporating changes in mobility in the absence of formally enacted social distancing policies …
“Estimating COVID-19 infections … We apply these IFRs [infection fatality ratios] to COVID-19 deaths estimated from our death model to produce age-specific rates of infection. These COVID-19 infection estimates, with COVID-19 death estimates, then feed into the transmission dynamics component of our new estimation platform (as described further in Part 2 below).”
Part 2 of the new IHME strategy: Fitting and predicting disease transmission dynamics.
“Today’s release brings a major advance in our COVID-19 estimation platform: the addition of a susceptible-exposed-infected-recovered (SEIR) component to our multi-stage model. This allows us to account for potential increases in transmission intensity if – or as the data increasingly suggest, when – social distancing mandates are eased and/or human mobility patterns rise. The latter is particularly important, as it appears that many populations are exhibiting increases in movement and thus possible interactions with each other, even in places where distancing policies remain in place.
“How does our overall SEIR modeling component work? First, we combine the observed and predicted daily COVID-19 death counts for the next eight days by location with corresponding estimates of IFR; this produces estimates of how many individuals may be infected in each location through time. We then model the rates at which infectious individuals may come into contact and infect susceptible individuals (denoted as beta, equating the effective reproductive number known as Rt) as a function of a number of predictors that affect transmission (see Part 3 below). Once susceptible individuals become infected, they are then considered exposed – the E part of SEIR – where they are first not infectious (incubation) and then become infectious …”
Part 3 of the new IHME strategy: Using independent drivers to inform the trend in the COVID-19 epidemic
“With today’s release, we are directly modeling disease transmission as a function of mobility, as well as temperature, testing rates, and the proportion of populations that live in dense areas. We have also made improvements in our mobility estimates and produce forecasts of mobility. In addition, we have incorporated information on other key potential drivers of COVID-19 transmission and trajectories.
“Driver 1: Daily temperature… It is very possible temperature will become a stronger predictor into May and June.
Driver 2: Percentage of populations living in highly dense areas.
Driver 3: COVID-19 testing per capita.
Driver 4: Changes in human mobility and its relationship to social distancing policies.”
2. When will this be over? The short answer is when a safe, effective vaccine is generally available. The more complicated answer is a question: over for whom? It is increasingly clear that COVID-19 infection is much more dangerous for some people than it is for others. Important risk multipliers are:
a. Age 60 or 65+ and especially elderly 85+.
b. Obesity
c. Diabetes
d. Cigarette smoking
e. Other chronic disease: coronary artery disease, hypertension
f. Severe underlying lung disease: emphysema (but not asthma)
g. Serious immune compromise: kidney transplant, patients currently receiving chemotherapy.
h. Race: it has been widely reported that African Americans are at greater risk of dying from COVID-19 than are individuals described as being of a different race. This observation may be true but is very difficult to test, firstly because many states and cities do not report the race of the people who die of COVID-19; secondly, because even in those places where the race of people dying of COVID-19 is recorded, such recording is incomplete and probably inaccurate, thirdly, the determination of race is in many cases arbitrary; and finally, because the incidence of certain diseases including obesity and hypertension which themselves increase the risk of COVID-19 death is greater in the African American community.
Individuals who have one or more of the above conditions may not be at greater risk for acquiring the disease, but they are almost certainly at greater risk of respiratory failure and death. Those people who have a high risk of severe COVID-19 disease are well-advised to maintain an extreme degree of social distance and to use personal protective equipment (at least a face shield, or a face shield + mask) when traveling or when otherwise exposed to others, and some people, such as the elderly who live in nursing homes should have no contact with people who could be a source of infection until a vaccine or effective non-toxic treatment is available.
Even generally healthy young people who do not have chronic disease and who are at low risk of severe COVID-19 do not want to get this disease. Young people make up the majority of the population. Of the 22 million Floridians, 66.1% or about 14.5 million are less than 55 years old and of all the COVID-19 deaths which occur in Florida, only 7% occur in those people. For the great majority of young healthy people, COVID-19 is a mild or moderately unpleasant illness, although some young people do become seriously ill and about 28% of all hospital admissions in Florida are of people <55 years old. In short, the best strategy is to avoid this disease and to choose the degree of your self-protective measures based on the risk of severe disease and death, should you become infected.
The new IHME model accounts for changes in social distancing and other mitigation measures as well as the results of increasing contact of people with each other. Look at the curves for certain states, beginning with New York, which has suffered through a terrible epidemic:
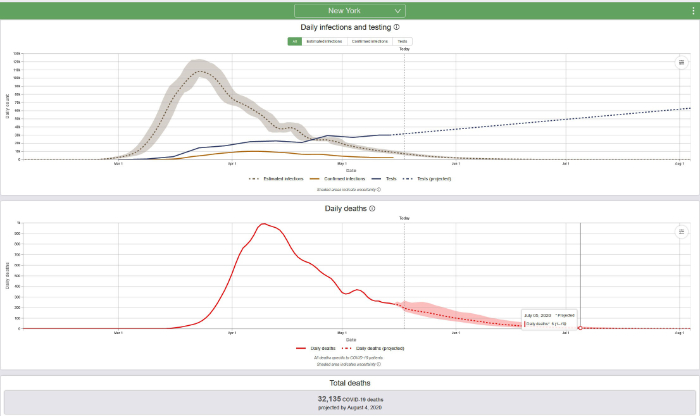
One way to determine when the COVID-19 epidemic will be over is to predict the date when the death rate will be 0.3 deaths per million and/or the date when the prevalence will be 1 case per million. The population of New York State is approximately 19.5 million; therefore, 0.3 deaths per million population = 6 deaths and 1 case per million = 20 cases. It now appears, based on daily deaths and/or disease prevalence (estimated infections) that in New York State the COVID-19 epidemic is declining. The IHME predicts that daily deaths in New York will decline to 6 deaths on July 5, 2020 (revised from the previous prediction of July 13, 2020) and that prevalence will decline to 20 cases on July 16, 2020 (revised from previous prediction August 4, 2020). Based on what we know today and based on the current IHME model, that is when the epidemic will be over in New York.
Now let us look at Florida:
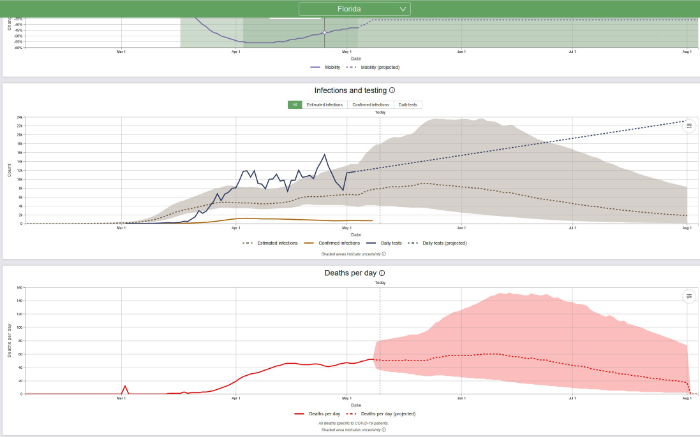
The population of Florida is approximately 22 million; therefore, 0.3 deaths per million population = 7 deaths and 1 case per million = 22 cases. It now appears, based on daily deaths and/or disease prevalence (estimated infections) that in Florida the COVID-19 epidemic is stalled but it is anticipated to start declining by the second week of June. The IHME predicts that daily deaths in Florida will decline to 10 deaths on August 4, 2020. Prevalence will probably decline to 22 cases well after that, sometime in late summer or early fall. Based on what we know today and based on the current IHME model, that is when the epidemic will be over in Florida.
It is important to note the IHME’s warning, issued May 10, 2020:
Unless concerted efforts to accelerate testing and other key containment strategies take place (e.g., contact tracing and case-based isolation, the widespread use of masks in public), there could be an elevated risk for exposure to the novel coronavirus (SARS-CoV-2) and thus transmission among communities, or even resurgence of COVID-19 infections and mortality.
We plan to show in an article to be submitted for publication and in an upcoming narrative report that as a practical matter, the widespread use of masks for indoor public interactions will be necessary in Florida and states with similar disease prevalence in order to stop the epidemic.
3. Pediatric cases of COVID-19 and Multi-system Inflammatory Syndrome in Children (MIS-C) Associated with Coronavirus Disease 2019 (COVID-19) – HEALTH ADVISORY OF THE CDC https://emergency.cdc.gov/han/2020/han00432.asp
a. Pediatric cases are uncommon, often (68%) asymptomatic and a large proportion were detected in New York: On April 6, 2020, the Morbidity and Mortality Weekly Report (MMWR) of the CDC released a special report titled “Coronavirus Disease 2019 in Children — United States, February 12–April 2, 2020. MMWR Morb Mortal Wkly Rep 2020;69:422–426.” This report is available online at http://dx.doi.org/10.15585/mmwr.mm6914e4 and its main points were summarized on April 8, 2020, by Dr. Deborah Lehman of the NEJM: “Researchers examined almost 150,000 laboratory-confirmed cases of COVID-19 between February 12 and April 2. Of these, 2572 (1.7%) were <18 years old, and 33% of pediatric cases were from New York City. For cases with available information, findings include:
i. Median age was 11 years (range, >1 to 17 years).
ii. 73% of children had the classic COVID-19 symptoms (fever [56%], cough [54%], shortness of breath [13%]) versus 93% of adults.
iii. Other symptoms noted in children included sore throat (24%), headache (28%), and myalgias (23%), all at lower frequencies than reported in adults.
iv. Hospitalizations were lower for children (5.7%) than for adults aged 18 to 64 years (10%), including fewer intensive care unit admissions.
v. 68% of children had no symptoms (there was incomplete symptom reporting).
vi. 23% of children had an underlying condition, including asthma, immunosuppression, and cardiovascular disease.”
b. Since April 26, 2020, there have been worrisome reports of an acute inflammatory condition similar to Kawasaki Disease arising in children in England and New York City. The condition is also being referred to as “pediatric multi-system inflammatory syndrome”. Most but not all of these children have tested positive for COVID-19, either by nasal swab nucleic acid detection (or RT-PCR) or by the detection of COVID-19 serum antibodies. Kawasaki Disease or KD is an acute febrile illness of unknown etiology that primarily affects male children younger than 5. The illness is characterized by vasculitis (inflammation of blood vessels) resulting in fever, rash, swelling of the hands and feet, irritation and redness of the whites of the eyes, swollen lymph glands in the neck, and irritation and inflammation of the mouth, lips, and throat. KD is diagnosed based on the presence of fever for 5 or more days and 4 out of the following 5 abnormalities:
i. Bilateral conjunctival redness
ii. Cracked and erythematous lips and strawberry tongue
iii. Swollen lymph nodes in the neck
iv. Redness and/or swelling of the extremities and/or palm and sole desquamation
v. Rash
In addition, some children diagnosed with COVID-19 associated KD have experienced GI symptoms including abdominal pain, vomiting, or diarrhea. Most children with this syndrome have not experienced respiratory symptoms but some have developed low blood pressure and they required intensive care unit management.
The main problem with classical KD is that it can be complicated by the development of coronary artery dilatations and aneurysms. KD unrelated to COVID-19 is uncommon. The U.S. CDC estimates an incidence of KD ranging from 9 to 19 per 100,000 children under 5 years of age. It is important to make the diagnosis of KD because it is a treatable disease. Treatment with intravenous immunoglobulin and aspirin significantly improves outcome; however, aspirin is associated with an uncommon complication in children called Reye’s Syndrome and aspirin should not be given to children without close medical supervision. There are no specific tests for KD although certain blood tests are useful for the exclusion of other diseases.
c. On 12 May 2020, the media reported as many as 100 cases of pediatric multi-system inflammatory syndrome likely linked to COVID-19. So far, 3 children have died and another 2 deaths are being investigated. Cases have been reported as long as 6 weeks after exposure to the COVID-19 virus.
d. On May 14, 2020, the U.S. CDC issued a Health Advisory distributed via the Health Alert Network. The advisory includes the following case definition:
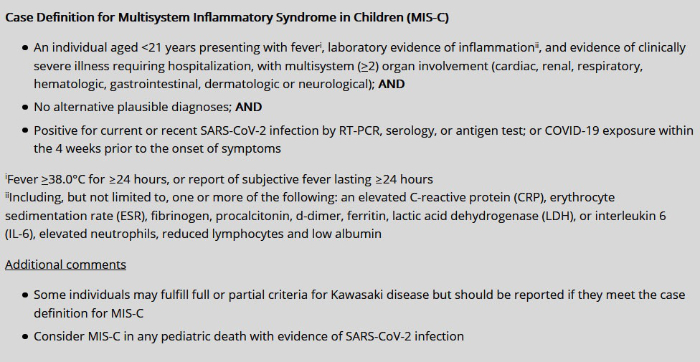
Healthcare providers who have cared or are caring for patients younger than 21 years of age meeting MIS-C criteria should report suspected cases to their local, state, or territorial health department.
For additional information, please contact CDC’s 24-hour Emergency Operations Center at 770-488-7100. After-hour phone numbers for health departments are available at the Council of State and Territorial Epidemiologists website (https://resources.cste.org/epiafterhours).
e. Background information about Multi-system Inflammatory Syndrome in Children (MIS-C) Associated with Coronavirus Disease 2019:
It has become evident beyond doubt that the COVID-19 pandemic has seen a corresponding significant increase in a rare inflammatory syndrome similar to Kawasaki Disease. A recent observational study conducted in Italy and published in the Lancet by Verdoni et al found a thirty-fold increase in the incidence rate of a Kawasaki-like disease in pediatric patients (all aged 2.9-9.2, except for 1 aged 16) in the month COVID-19 was most rapidly spreading among the population when compared to the past 5 years (19 cases in 5 years compared to 10 cases in 1 month, p < 0.00001). Kawasaki disease itself has no diagnostic test; cases are instead confirmed based on hallmark symptoms. It is important to note that in the Kawasaki-like disease seen in the pandemic, some clinical presentation has been significantly different than in typical Kawasaki disease patients, hence the “Kawasaki-like” label, as the diseases are clearly related but also clearly not identical.
8 of the 10 patients with Kawasaki-like disease in the study tested positive for antibodies to the SARS-CoV-2 virus, and one of the 2 who tested negative had just received an antibody treatment for the disease that could have impacted the test result. The remaining patient may have presented with a typical case of Kawasaki disease unrelated to the COVID-19 pandemic, or testing errors may have occurred. Interestingly, only 2 of the patients tested positive for the SARS-CoV-2 virus in a nasal swab, suggesting that this Kawasaki-like disease develops late in the course of the virus (or even after the virus has run its course). Previous research has provided some (if inconclusive) evidence that an immune response to antibodies for other coronaviruses is the cause of typical Kawasaki disease. This, along with the (very limited) evidence above, has led us to preliminarily hypothesize that this new Kawasaki-like disease may be caused by an immune reaction to antibodies formed against the SARS-CoV-2 virus in certain genetically predisposed children.
As this condition is still exceedingly rare, the risk to children in the general population is very low. Reassuringly, all 19 patients with Kawasaki disease and all 10 patients with the Kawasaki-like disease in the context of the COVID-19 pandemic responded to treatment, and the general mortality rate seen in Kawasaki disease is less than 0.5%. Even so, vaccine researchers, policymakers, and doctors should take this risk factor into account when designing vaccines, issuing recommendations, and providing treatment for COVID-19 in pediatric patients, i.e. the risk of Multi-system Inflammatory Syndrome in Children (MIS-C) Associated with Coronavirus Disease 2019 may represent a relative or even absolute contraindication to COVID-19 vaccination of children.
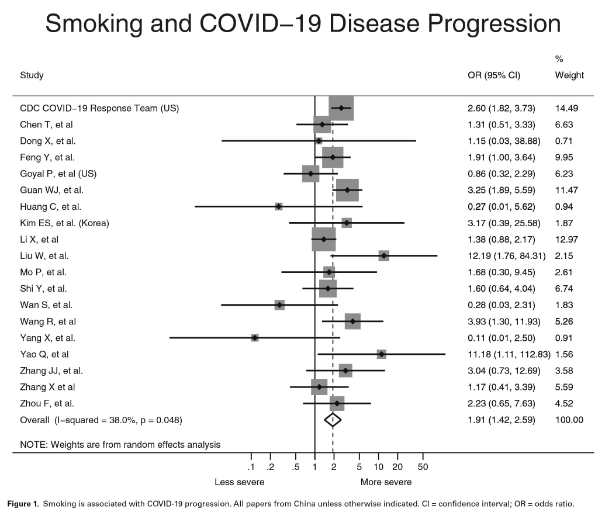
4. A meta-analysis by Dr. Roengrudee Patanavanich of Ramathibodi Hospital, Mahidol University, Bangkok, Thailand and Dr. Stanton Glantz of the Department of Medicine, University of California, San Francisco published on May 11, 2020, finds compelling and significant evidence that a history of cigarette smoking increases the odds of severe COVID-19 disease progression when compared to never-smokers. The analysis found that the odds of developing severe COVID-19 disease were 1.91 times higher in people with a history of smoking than in never smokers, with a 95% confidence interval from 1.42-2.59 (P = 0.001). This data is supported by biological principles as well because smoking decreases pulmonary immune function. If anything, the reported increase in risk is understating the true increase in risk, as smoking appears to be under-reported among COVID-19 patients. The analysis looked at 19 peer-reviewed papers from scientists in the United States, Korea, and China. The prevalence of smoking identified in each of those studies was lower than the actual prevalence of smoking in each country, probably because of inadequate history taking, especially from very sick patients.
The analysis inspires near-assuredness that once a person has contracted the SARS-CoV-2 virus and has been admitted to a hospital, they are (with 97.5% confidence) at the very least 1.42 times more likely to have severe disease progression than a never-smoker, though the true increase in risk may be closer to 3 or more times more likely if smoking is being under-reported, as suggested. It does not show either way whether smoking is more likely to increase the risk of severe disease progression or death due to COVID-19 for a person who has not been admitted to a hospital.
The forest plot which displays the odds ratio identified by the 19 studies summarized by Patanavanich and Glantz is shown below.
5. On May 11, 2020, Dr. Cristina Menni of King’s College, London, and colleagues from the Massachusetts General Hospital and Harvard Medical School published a report in the journal Nature Medicine which described the development of an Apple iPad and smartphone app named the COVID Symptom Study. Between 24 March and 21 April 2020, this app was used to report daily health status and symptoms by 2,450,569 individuals in the United Kingdom and 168,293 individuals in the United States. The authors reported:
A model combining symptoms to predict probable infection was applied to the data from all app users who reported symptoms (805,753) and predicted that 140,312 (17.42%) participants are likely to have COVID-19.
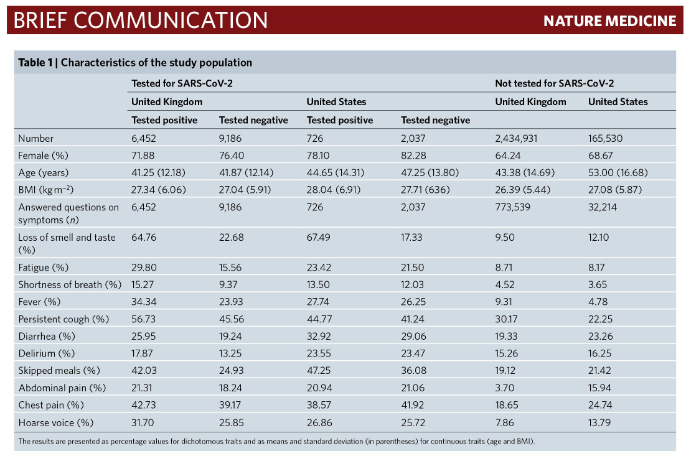
The authors generated “a linear model for symptoms that included loss of smell and taste, fatigue, persistent cough and loss of appetite to obtain a symptoms prediction model for COVID-19”. In the UK population, the prediction model had a sensitivity of 0.65 (0.62–0.67), a specificity of 0.78 (0.76–0.80), a positive predictive value of 0.69 (0.66–0.71), and a negative predictive value of 0.75 (0.73–0.77). When the model was applied to the U.S. population, it had a sensitivity of 0.66 (0.62–0.69), a specificity of 0.83 (0.82–0.85), a positive predictive value of 0.58 (0.55–0.62) and a negative predictive value 0.87 (0.86–0.89).
The above means that the combination of symptoms used by the app, as self-identified and tracked by the user, can identify COVID-19, without other testing such as a nasal swab, in about 66% of cases (34% false-negative rate) and when the app indicates that a user has COVID-19 the test is correct most of the time (about 20% false positive).
Depending on the severity of the app user’s symptoms and his/her risk characteristics (increased with increasing age, obesity, chronic disease) the results of the COVID Symptom Study app should be promptly verified by nasal swab nucelic acid testing and the app user should consult a physician. Menni et al used the COVID Symptom Study app in an attempt to determine the prevalence of COVID-19 in the general population:
We applied the predictive model to the 805,753 UK and US symptom-reporting individuals who had not been tested for COVID-19 and found that, according to our model, 140,312 (116,400–164,224) of these 805,753 participants (17.42% (14.45– 20.39%) reporting some symptoms were likely to be infected by the virus, representing 5.36% as a proportion of the overall responders.
The COVID Symptom Study app will probably prove to be a valuable adjunct to other forms of testing. For example, medical, rehabilitation, and dental practices can request their patients to use the app for several days prior to a non-emergency clinical visit. A wide variety of businesses that provide services involving direct human contact can also ask clients to use the app prior to service. High schools, colleges and other educational institutions can encourage their students to use the app for the purpose of early detection and prevention of spread of disease. If a user of the COVID Symptom Study app tests positive, he or she can advise close personal contacts to seek testing and can self-quarantine, thus achieving a kind of contact tracing and containment.
6. Comparing COVID-19 death rates to death rates of influenza and other epidemic and non-epidemic diseases using age-specific and age-adjusted rates:
a. There is a high incidence of COVID-19 disease and a high case fatality ratio in New York City. The NYC death rates should be compared to death rates for influenza, heart disease, and cancer among residents of the same city and NYC COVID-19 rates should be compared to rates observed in other parts of the United States. Such comparisons will further identify risk multipliers which will help explain the basic nature of the disease.
b. For more than a month I and many others have reported that the COVID-19 death rate per 100,000 NYC residents was markedly greater than the death rate in Miami Dade and most other American cities. On April 12, 2020, we reported that the New York City death rate was 20 times greater than the rate in Miami, and today we report (see Excel spreadsheet) that the NYC rate is (234.55/19.37) 12 times greater.
c. Because different regions have different age distributions and because many diseases affect younger and older people differently, it is often important to compare “age-specific death rates” (ASDR) rather than “crude” (uncorrected for age) death rates. An ASDR is calculated by dividing the number of deaths in an age group by the population of that age group multiplied by a constant (usually 100,000 population). Calculating an ASDR is important when comparing diseases which affect the population of New York City which in 2018 had an estimated median age of 36.9, with only 14.8% of its population 65 and older, to Miami which in 2018 had an estimated median age of 37.9 with 18.8% of its population 65 and older (U.S. Census, 2018 estimates). Because COVID-19 is associated with a significantly greater risk of death in people 65 and older, just the difference in age distribution accounts for some of the difference in death rates. In order to calculate an age-specific death rate (ASDR) it is necessary to know the age distribution of the population and the age of those who die. The Departments of Health of both the State of Florida and New York City provide that kind of detail about COVID-19. Florida also provides mortality data by age group for influenza and other diseases but NYC provides only partial age data.
d. A valuable statistic called the age-adjusted death rate (AADR) makes it possible to compare death rates in different cities that have different age distributions. The AADR is a weighted average with each age-specific death rate (ASDR) weighted by the proportion of people in the same age group compared to the proportion of people in the U.S. year 2000 “standard population”. It is not necessary for the proportion of the standard population to be exactly correct, it is only necessary for everyone to agree to use that value. In order to calculate the ASDR and the AADR for COVID-19, it is necessary to know the age of each person who died in each location of interest. Such data is not generally available for all cities and states, but it is available for Florida and New York City.
e. We have been reporting the “crude” or raw COVID-19 death rate for Florida. That rate is useful because reported death rates for the states and for the USA are generally not age-corrected; nevertheless, as of 12 May 2020, we have been reporting ASDR, AADR, and crude rates for Florida and NYC for COVID-19, influenza and other major causes of death.
f. In addition to current age-specific death rates (ASDR) and age-adjusted death rates (AADR) we calculate and display predicted ASDRs and predicted AADRs based on the total number of deaths the Institute for Health Metrics and Evaluation (IHME) predicts will occur in Florida and New York City by August 4, 2020, which we hope will be the end, or near to the end, of the current epidemic. This requires some explanation, as follows:
g. First, a recap of ASDR and AADR: Florida is ranked 5th for median age among 56 U.S. states and territories. Because the median age and the proportion of people 65 and older are both greater in Florida than in the US 2000 standard population, the contribution to the AADR by older people in Florida is less than their contribution would be based on their actual proportion in the state and the AADR today for Florida is less than today’s crude COVID-19 death rate, that is, today’s Florida AADR is 5.98/100,000 compared to the crude death rate of 9.08. Today’s Florida COVID-19 AADR can be compared to the Florida influenza AADR of 9.8 (for 2018, the most recent available data), heart disease AADR of 203.20, and cancer AADR of 146.20. These values are reliable, reflect the overall impact of COVID-19 and other diseases on the Florida population as a whole, and can be compared to AADRs for other locations (below). Today’s AADR of 5.98 also emphasizes how dangerous COVID-19 is for segments of the population, because today’s age-specific COVID-19 death rate (ASDR) for Floridians 65-74, which is 17.64, is nearly 3 times today’s Florida AADR of 5.98. Worse still, today’s COVID-19 ASDR for Floridians 75-84 is 41.75 and for the elderly 85 and older it is 114.
h. Today’s COVID-19 age-adjusted death rate (AADR) for New York City at 216 is minimally lower than its crude death rate of 242 but it is much greater than today’s Florida COVID-19 AADR of 5.98. Furthermore, the NYC age-specific death rates are much worse than the Miami ASDRs; for example, the most recent ASDR for New Yorkers 65-74 of 704 is a hard-to-believe 40 times greater than the ASDR for Floridians 65-74 which is 16.57. Also, the ASDR for New Yorkers 75 and older of 1,857 is a hard-to-believe 30 times greater than today’s ASDR for Floridians 75+ which is 62. Furthermore, the NYC AADR of 216 is more than 10 times greater than the 2016 NYC influenza/pneumonia AADR of 18.1. This is why the residents of New York City and their doctors and nurses feel like they are in a battle zone and why first responders, health care providers and reporters are hostile to suggestions that COVID-19 is just a bad flu. Today’s Excel spreadsheet shows that the non-age adjusted mean death rate /100,000 for the hardest hit quintile of U.S. states (the worst 10 of the states) is 85/100,000 whereas for the least severely affected quintile the non-age adjusted mean death rate is 3.3. Florida is slightly lower than the midpoint of the 50 states and D.C., today ranking #28. It is easy to understand why citizens and health care providers in the worst affected 10 states have a different view of COVID-19 than people in the least affected 10 states.
i. We are very sensitive to the fact that the numbers we are quoting are not at all just numbers, but rather, they represent many thousands of our fellow citizens who have died, and who will die, during this epidemic. Indeed, these numbers represent cherished grandparents, parents, other relatives, friends, and even, most terrible, children. Even so, we see it as our duty to dispassionately consider the COVID-19 epidemic in context of other causes of death and so, under the Excel spreadsheet tab labeled “C19 deaths vs other causes” we show the COVID-19 age-specific death rates and age-adjusted death rates for Florida and New York City as well as predicted ASDRs and AADRs based on the number of deaths that the IHME predicts will occur by August 4, 2020.
j. In order to calculate predicted ASDRs and AADRs we assume that the age-specific proportion of the COVID-19 deaths will remain about the same. For example, up until now in Florida, only 0.747% of all the COVID-19 deaths have occurred in residents 25-34 years old whereas 21.973% of the deaths have occurred in residents 65-74. The IHME has provided us with an overall prediction of the number of deaths that will occur in Florida by August 4, 2020. We used the age-specific proportion observed up until now and the IHME overall prediction for Florida to calculate the predicted Florida ASDR and with that value and the year 2000 standard US population we calculated the ultimate Florida AADR. We performed the same calculations for New York City (up until now NYC deaths have equaled .745 of the New York State deaths).
k. Armed with the predicted ASDRs and the predicted AADR, we can now more accurately see in advance what the ultimate consequences of the COVID-19 epidemic will be compared to other diseases. For example, for Florida, see the age-specific death rate (ASDR) for Floridians 55-64 which is today 6.24/100,000 and is predicted to end up being 2.4x greater at 14.74. Now go across the table and compare to the ASDR for motor vehicle accidents (MVA) which at 18 is 3x greater than the current Florida COVID-19 ASDR for Floridians 55-64 and is higher than the predicted (August 4, 2020) COVID-19 ASDR for the same age group, and yet, almost all Floridians 55-64 get into an automobile every day. Whether they are aware of it or not, adults manage risk and as a result, some die, but relatively few. Now consider the current (6.24) and the predicted (14.74) COVID-19 ASDR for Floridians 55-64 compared to the 2018 influenza/pneumonia ASDR which was 11.5, the heart disease ASDR which was 236 and the cancer ASDR which was 290, all per 100,000 Floridians 55-64 years old.
Further, consider the COVID-19 age-adjusted death rate (AADR) which is a good measure of the overall risk experienced by the Florida population. The Florida AADR is today 5.98 which is low (unless you or a loved one contributed to that statistic). This is the value that people do not know, but they do feel. Of 50 states plus D.C., Florida is today ranked #28 in COVID-19 mortality. That means that 23 states have lower overall COVID-19 death rates than we do in Florida. It is easy to understand why people want to get out of the house. Based on the IHME predictions, the Florida age-adjusted death rate will probably be 14.13 by August 4, 2020, which is a value similar to the Florida motor vehicle age-adjusted death rate which is 14.7 and much less than the Florida heart disease age-adjusted death rate of 203.
l. The above arguments have certain important limitations. The COVID-19 epidemic is not yet over and the IHME predictions, although based on increasingly complex modeling and additional data, may be over- or underestimates. It is not known whether or not easing of social distancing and increased human mobility will result in a resurgence of the epidemic. I doubt that epidemic containment, which traditionally relied heavily on contact tracing, will be successful. On the other hand, rapid, accurate, easy to tolerate nasal swab testing will be available for special populations and will help identify pre-symptomatic and asymptomatic infected individuals and thereby reduce transmission of the virus. The widespread daily use of masks +/- face shields will also help. Widespread acceptance of diagnostic smartphone apps such as the COVID-19 Symptom Study (discussed above), which are associated with a diagnostic sensitivity and specificity not much different than nasal swab nucleic acid testing, may greatly facilitate contact tracing. Rising ambient temperature, not only in Florida but also in the rest of the country, will probably reduce spread of the disease. Our data modeling and analysis (which we anticipate will be submitted for publication soon) preliminarily indicates that ambient temperature, along with certain other factors, greatly impacts the transmission of this virus.
I do not anticipate that easing of social distancing and return to work and school will result in an explosive resurgence of the COVID-19 epidemic, but I am not certain. If the epidemic does roar back, we will be primed to spot it and severe measures will again be justified. The ultimate solution for this epidemic, and future epidemics, is vaccination. Some preliminary good news regarding safety and efficacy of a vaccine developed by the Moderna Company was announced on May 18, 2020.
7. On May 1, 2020, JAMA Internal Medicine published online a report by Cheng et al of the Epidemic Intelligence Center, Taiwan Centers for Disease Control titled “Contact Tracing Assessment of COVID-19 Transmission Dynamics in Taiwan and Risk at Different Exposure Periods Before and After Symptom Onset”.
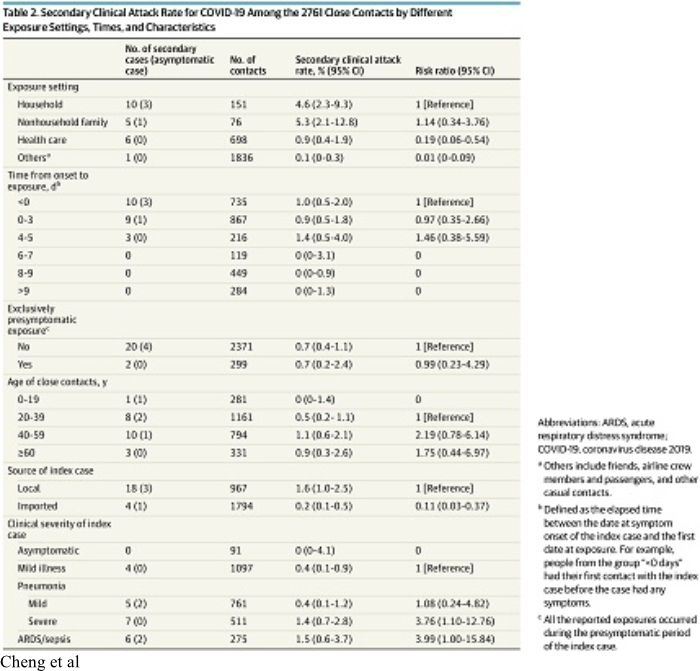
Cheng et al enrolled into their study all of the initial 100 confirmed cases (“index cases”) of COVID-19 which occurred in Taiwan between January 15 and March 18, 2020. They also identified 2,761 close contacts of the original 100 test-confirmed cases. The close contacts were quarantined at home for 14 days after their last exposure to the index case. This study produced valuable information about the contagiousness of COVID-19. The results are summarized in Table 2 of the paper which is reproduced above.
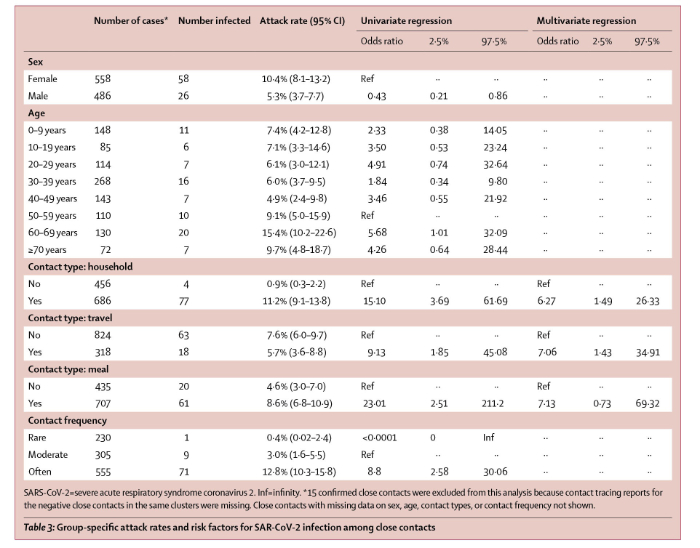
On April 27, 2020, Lancet Infectious Diseases published online a report (with correction May 5, 2020) by Bi and multiple other scientists of the Shenzhen Center for Disease Control and Prevention, Shenzhen, China, multiple other scientific entities in China and the Department of Epidemiology and the Department of International Health of Johns Hopkins Bloomberg School of Public Health. The paper is titled “Epidemiology and transmission of COVID-19 in 391 cases and 1286 of their close contacts in Shenzhen, China: a retrospective cohort study”. Bi et al report their analysis of 391 COVID-19 cases identified from Jan 14 to Feb 12, 2020 by the Shenzhen Center for Disease Control and Prevention. The results are summarized in Table 3 of the paper which is reproduced below.
The key points of the papers published by Cheng et al are compared to those published by Bi et al:
a. Although COVID-19 is commonly described as “very contagious”, it is not. Of the 2,761 close contacts of the original 100 index cases identified by Cheng et al, only 22 secondary cases developed for an overall infection risk of 0.8% (95% CI, 0.5%-1.2%). Bi et al reported a larger overall infection risk, but only in household or other contacts who had multiple interactions with index cases. Bi et al reported that of individuals who had non-household contact with 456 index cases, only 4 (0.9%, 95% CI 0.3–2.2) developed disease but of those who had household contact with 686 index cases, 77 or 11.2% (95 CI 9.1-13.8).
b. Bi et al stated “We were able to directly estimate important transmission parameters, and show that, at least among observed contacts, transmission rates are low.” As shown in table 3 of the Bi paper (above) of the 230 individuals who had “rare” contact with index cases, only 1 (0.4%) became infected; however, Bi also showed that of 305 individuals who had moderately frequent contact with index cases, 9 or 3% became infected and of the 555 people whose contact with index cases was described as “often” 71 or 12.8% developed COVID-19. Bi et al stated “In Shenzhen, SARS-CoV-2 transmission most probably occurred between very close contacts, such as individuals sharing a household. However, even in this group fewer than one in six contacts (ie, secondary attack rate 11–15%) were infected, and overall we observed far fewer than one (0·4) onward transmission per primary case.”
c. Cheng et al demonstrated that the median incubation period was 4.1 days (95% credible interval 0.4-15.8). Bi et al determined mean incubation period of 4.8 days (95% CI 4·2–5·4).
d. A disease does not have to be very contagious in order to result in a large epidemic. Even if the infection risk of a disease is low (i.e. not many contacts of an index case develop the disease), an epidemic will occur if the exposed population is made up of individuals who are not immune, the majority of those infected do not die (and therefore can pass the disease on) and the incubation period is short. Furthermore, even if each interaction an index case has with an individual close contact has only a low chance of resulting in a secondary case, if the index case has a large number of interactions with non-immune people a large number of secondary cases will occur.
e. Of the 22 secondary cases reported by Cheng, 18 were symptomatic and 4 were asymptomatic. The secondary clinical attack rate (i.e. not counting asymptomatic secondary cases) was 18 of 2,761, or 0.7% (95% CI,0.4%-1.0%).
f. All of the secondary cases reported by Cheng occurred in people whose exposure to an index case occurred during the first 5 days of the index case’s illness. Secondary cases did not develop in individuals whose first contact with an index case occurred 6 days or later after the onset of the index case’s disease. This has implications for the significance of positive nasal swab nucleic acid tests done >6 days after onset of illness. People (including health care providers being considered for return to work) who have a positive nasal swab are assumed to be shedding virus and capable of infecting others, but it may well be that swab tests in such recovering people identify non-infectious residual virus. The Cheng study has to be confirmed epidemiologically and by virology before policy regarding “clearing” health care providers can be changed.
g. Cheng et al identified transmission of disease as the result of contact with an index case before the first onset of the index case’s symptoms. Of 299 people whose only contact was to an index case before the onset of symptoms (a pre-symptomatic case), the secondary clinical attack rate was 0.7% (95% CI, 0.2%-2.4%).
h. The secondary clinical attack rate reported by Cheng was significantly greater as the result of contact with family or non-family household member index cases, although it was still not very high. The secondary clinical attack rate was 4.6% (95%CI, 2.3%-9.3%) among 151 household contacts and 5.3% (95%CI, 2.1%- 12.8%) in 76 non-household family contacts.
i. Although it is widely believed that contact with people who have asymptomatic disease can result in infection, this may not be true. Among the 91 close contacts of the 9 asymptomatic cases, there were 0 secondary cases.
j. The risk of secondary infection reported by Cheng was significantly greater as the result of contact with an index case who had severe disease.
8. On April 29, 2020, Eli N. Perencevich, MD, MS and colleagues of the University of Iowa, Iowa City published a “Viewpoint” article in the Journal of the American Medical Association which is all the more important because of the possibility of prolonged or recurrent spikes of COVID-19 epidemic predicted by Moore and her colleagues of CIDRAP of the University of Minnesota, presented above. The title of the Perencevich paper is “Moving Personal Protective Equipment Into the Community: Face Shields and Containment of COVID-19.” The authors observe “Experience and evidence, even during this pandemic, suggest that health care workers rarely acquire infections during patient care when proper PPE is used…” Perencevich et al go on to state:
“Face shields offer a number of advantages. While medical masks have limited durability and little potential for reprocessing, face shields can be reused indefinitely and are easily cleaned with soap and water, or common household disinfectants. They are comfortable to wear, protect the portals of viral entry, and reduce the potential for auto-inoculation by preventing the wearer from touching their face. People wearing medical masks often have to remove them to communicate with others around them; this is not necessary with face shields. The use of a face shield is also a reminder to maintain social distancing, but allows visibility of facial expressions and lip movements for speech perception.
“Most important, face shields appear to significantly reduce the amount of inhalation exposure to influenza virus, another droplet spread respiratory virus. In a simulation study, face shields were shown to reduce immediate viral exposure by 96% when worn by a simulated health care worker within 18 inches of a cough….”
Perencevich et al conclude:
“Face shields, which can be quickly and affordably produced and distributed, should be included as part of strategies to safely and significantly reduce transmission in the community setting. Now is the time for adoption of this practical intervention.”
 Dr. Feingold comments: a Miami based company appears to be making a good, re-usable face shield which it can deliver quickly. We advocate the use of face shields in general, not necessarily this specific product. This product has the advantage of being manufactured in the U.S. and not in China. Similar but less sturdy face shields are available on Amazon.com.
9. Epidemiological aspects of testing: At the end of March 2020, the FDA issued an emergency use authorization (EUA) for a new analyzer produced by Abbott Labs (ID NOW COVID-19).
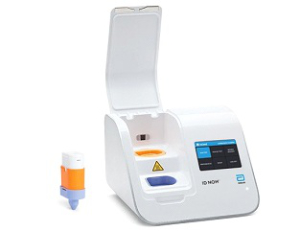 This device, which is about the size of a toaster, was originally intended to be used at the “point of care”, i.e. at the bedside inpatient care settings; however, early experience revealed a potential danger of aerosolization of the virus during preparation of the sample and therefore, the device should be used under a laboratory hood. Also, immediate post-market experience revealed a decrease in sensitivity when nasal swabs were transported in viral transport media; therefore, the swab should not be put into media but rather brought to the analyzer as soon as possible.
The gold standard for the detection of COVID-19 was real-time reverse transcription-polymerase chain reaction (RT-PCR) which is a complicated, lab-intense procedure which requires multiple steps beginning with the production of complementary DNA (cDNA) from a single-stranded RNA template in a reaction catalyzed by the enzyme reverse transcriptase at different temperatures (early in the COVID-19 epidemic many demanded to know why lab turn-around-time for this test was so long, that is, several days). The new Abbott analyzer uses a simpler and much faster analytical technique that can be completed at a single temperature, hence the designation reverse transcription loop-mediated isothermal amplification (RT-LAMP). The term “nucleic acid” refers to RNA or DNA. COVID-19 is a large single-strand RNA virus. The Abbott ID NOW device detects the presence of a gene-specific to the COVID-19 viral RNA named RdRp (RNA-directed RNA polymerase).
Although the Abbott ID NOW device is being rapidly deployed to hospitals, availability is still limited and at first, the test will be used primarily to confirm or exclude the diagnosis of COVID-19 in hospital patients. Patients who require or who may require intubation (many surgical patients) will be tested in order to identify those who are infected (pre-symptomatically, asymptomatically, or symptomatically) and who therefore could represent a risk of transmission of the infection to anesthesiologists, nurses and other health care providers. Another important use is the determination of the presence or absence of COVID-19 in the respiratory secretions of health care providers who are either quarantined because of a supposed contact or are recovering from the disease and need to get back to the front lines of hospitals, including ICUs.
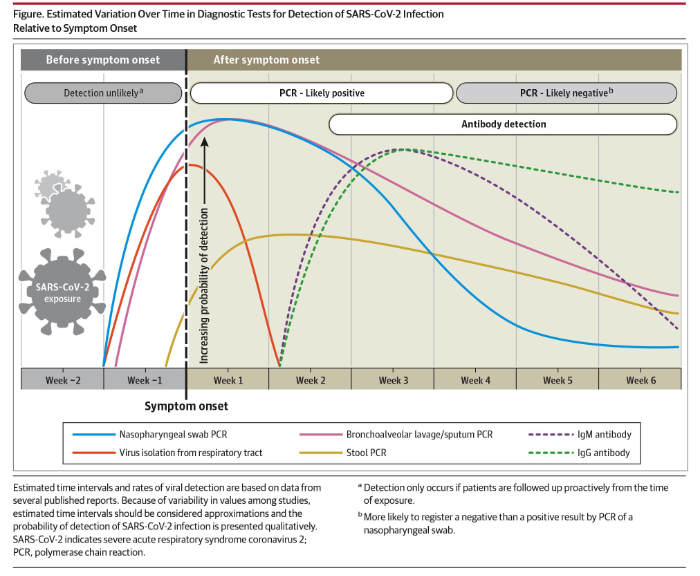
A second kind of test is a blood test to detect COVID-19 specific antibodies. In response to a viral infection, the body produces at least 2 kinds of antibodies which are immune chemicals capable of attacking outside invaders. The first type of antibody produced by the body during the early phase of infection is an IgM and the second kind of antibody which is produced during recovery and which contributes to long-lasting immunity is an IgG. On May 6, 2020, JAMA published a review titled “Interpreting Diagnostic Tests for SARS-CoV-2” written by Nandini Sethuraman, MD of the Department of Microbiology, Apollo Hospitals, Chennai, India, and her colleagues.
As part of their paper, Sethuraman et al provided the following summary of the use of nasal swab nucleic acid testing and testing for IgG and IgM levels:
On April 15, 2020 Abbott announced the availability of its new IgG antibody test “which will initially be available on its ARCHITECT® i1000SR and i2000SR laboratory instruments. More than 2,000 of these instruments are in use in U.S. laboratories.” Abbott announced that it is “ramping up to 20 million tests in the U.S. in June and beyond as it expands the tests to run on its new Alinity™ I system. Abbott also will be expanding its laboratory antibody testing to the detection of the antibody, IgM, in the near future.”
Antibody tests will be valuable for at least 3 reasons: firstly, the determination of anti-COVID-19 IgG antibodies in the serum of health care workers who have recovered from COVID-19 infection will identify most (about 80%) of those workers as immune and able to treat COVID-19 patients with less risk, and possibly even without personal protective equipment (PPE); secondly, the identification of elevated levels of IgG in individuals who have recovered from COVID-19 identifies those people as potential blood donors. Anti-COVID-19 antibodies from the blood of such donors can be used to treat other patients who have severe COVID-19 infection; thirdly, the determination of IgG antibodies in large sample populations will make it possible to calculate the overall prevalence of the disease in the population, despite the fact that many who have the disease are asymptomatic.
In their May 6, 2020 paper Sethuraman et al noted an additional application of serology testing, once the measurement of IgM is widely available. The authors noted that the combined sensitivity of PCR and IgM has already been demonstrated to be very high. Combined testing may prove to be valuable in the special situation of a seriously ill patient who has a negative nasal swab but who is strongly suspected of having COVID-19.
10. “Testing, testing, testing”. For reasons entirely unclear to me, many have been insisting that somehow “testing” will stop the COVID-19 epidemic. It is worthwhile to consider testing in terms of technology, strategy (for example as part of contact tracing), and epidemiology. Quick, easy, painless and accurate testing will be an important feature of contact tracing which will be necessary in order to avoid recurrent epidemics once social distancing has been eased. Targeted testing of populations at risk or special populations who represent a risk to others will be valuable. Additionally, testing of sample populations will help to establish prevalence and levels of immunity.
As the result of the COVID-19 epidemic many Americans have suddenly developed an interest in epidemiology. Statistical and epidemiological terms are used frequently by the media. It is a good idea to define some of the terms being used so frequently:
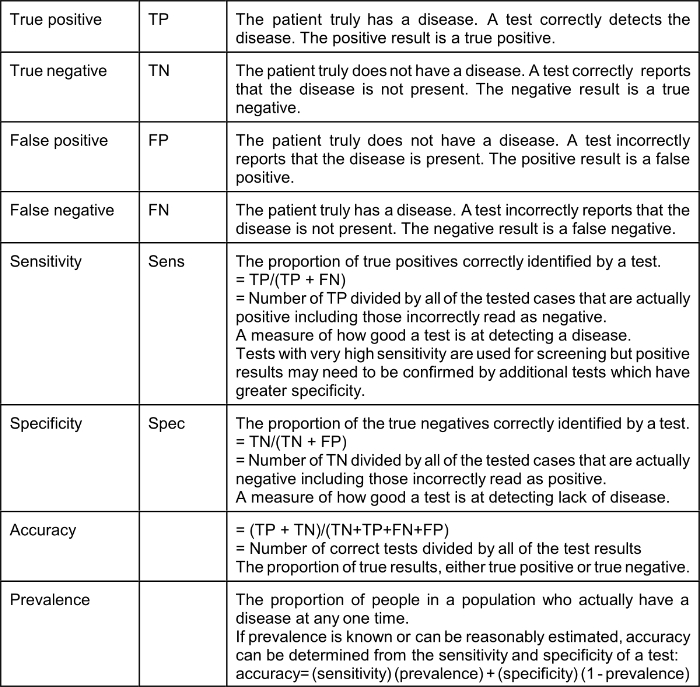
The effect of a low prevalence of a disease on the value of positive test results (“Positive Predictive Value” or PPV) is explained by Bayes’ Theorem (Thomas Bayes, 1701–1761), the complicated math of which many of us struggled within medical school. Bayes Theorem explains that in a situation where the “pre-test probability” (actual prevalence) is low, a positive result produced even by a test with very good sensitivity and specificity is not of much value. It should be intuitively obvious that a test that reads positive on a sample from a person who comes from a population where the condition or disease does not exist is a false positive; for example, a positive pregnancy test done on urine from a man is necessarily a false positive. Therefore, the Positive Predictive Value (PPV), which is the probability that the disease or condition is present when the test is positive, is low (in the example, zero).
PPV = sensitivity x prevalence / (sensitivity x prevalence) + (1-specificity) x (1-prevalence)
Using a very good test characterized by a sensitivity of 90% (10% false negative) and specificity of 93% (7% false positive): if the actual prevalence of a disease in the population from which the tested patient comes is 5% (a high number for COVID-19 in many communities) the Positive Predictive Value of a positive test is only 40%.* If the prevalence is 3% the Positive Predictive Value of a positive test is only 28%. It should be understood that Bayes’ Theorem applies to any kind of a test, including nasal swab tests and blood tests; however, the use of very highly specific tests based on the detection of a unique nucleic acid, such as the Abbott ID NOW which identifies the presence of a gene-specific to the COVID-19 viral RNA named RdRp (RNA-directed RNA polymerase) changes these calculations. Sethuraman et al suggest that “specificity of most of the RT-PCR tests is 100%.” If the specificity of a test is actually 100% it follows that the Positive Predictive Value is also 100%; however, even a slight decrease in test specificity when the true prevalence is low, for example, 5%, results in a surprisingly high false-positive rate. With a sensitivity of 90%, a specificity of 99% and pre-test probability (prevalence) of 5% the PPV of a positive test is 81.3%.
*https://www.medcalc.org/calc/diagnostic_test.php
The current COVID-19 epidemic will be suppressed by aggressive mitigation and, in some places like New York City where there was widespread infection, the development of herd immunity. The availability of new quick and accurate testing methods will be of benefit in the control of future disease “spikes” which can be anticipated to occur after social distancing is relaxed and until an effective vaccine is available. Testing will be useful for the early detection of new disease activity, especially disease “hot spots” and for contact tracing, a traditional public health technique that involves the identification of all the contacts of an infected person and the quarantine of those contacts who are found to test positive. On April 17, 2020, JAMA published online a “Viewpoint” article by infectious disease specialists Walensky and del Rio of Harvard Medical School and Emory University School of Medicine titled “From Mitigation to Containment of the COVID-19 Pandemic Putting.” The authors emphasized the importance of testing strategies to be applied after the current acute phase of the COVID-19 epidemic has ended. Walensky and del Rio state:
The cornerstone of the next phase will require massive testing, in 2 forms. First, serologic testing that detects immunoglobulins (IgM and IgG) specific for SARSCoV- 2 will provide estimates of population exposure. Because a significant number of individuals with COVID-19 are asymptomatic or mildly symptomatic, the population fraction that has been infected remains unknown. It must be presumed (and hoped) that prior exposure provides some protection, at least long enough to bridge to a vaccine. With an estimated reproduction number (R0) of 2 to 3, the benefits of herd immunity will occur when 50% to 66%of the population has already been infected, whether or not symptomatic. These population estimates could help guide the necessary level of vigilance and intervention.
In contrast to COVID-19, the R0 of measles is approximately 18. In order to stop or prevent an epidemic of measles, herd immunity of >90% must be achieved, much preferably by vaccination. Walensky and del Rio go on to explain:
Second, virologic polymerase chain reaction testing that detects active disease is important to effectively stop transmission…. because asymptomatic and pre-symptomatic transmission is important, additional wide-scale intermittent testing (eg, weekly) of asymptomatic persons also may be required, particularly for individuals with significant exposure to others, such as athletes, teachers, service industry employees (eg, in retail and maintenance), and health care workers.
… testing alone is insufficient. Vital to any screening program is the action taken when a test result is positive. People identified with COVID-19 must be immediately informed, educated, isolated, and then their contacts efficiently identified, all in a manner sensitive to individual needs. Modeling studies suggest that to achieve effective control, contacts must be quarantined within 24 hours…
The reader should understand that in the context of epidemiology “containment” means a coordinated program of large scale testing for the detection of acute disease (e.g. analysis of nasal swab by the Abbott ID NOW COVID-19) and prompt contact tracing and quarantine of positive contacts. As explained further above, such containment will have to be applied once the nation returns to normal status in order to prevent recurrent “spikes” or even recurrent epidemics. If a disease escapes containment, mitigation is necessary. Mitigation relies on non-pharmaceutical interventions such as hand hygiene, travel restrictions, school and business closures, and social distancing which are inconvenient, socially, and economically harmful and highly effective.
11. Underlying serious health conditions increase the risk of a severe outcome in COVID-19: The explanation for the markedly increased susceptibility of older people to this virus is still not available. One explanation that has been proposed is that with increasing age many people accumulate chronic illnesses such as obesity, hypertension, and type II diabetes which are normally manageable and not immediately threatening but which may decrease the potency of a person’s natural defenses. The Chicago Department of Health reports that as of April 21, 2020 it had identified 13,612 cases of COVID-19 and 593 deaths. Of 560 patients who died and whose medical history was available, 519 or 92.7% had at least one known chronic medical condition, most commonly diabetes, hypertension, and lung disease. See https://www.chicago.gov/city/en/sites/covid-19/home/latest-data.html
The Department of Health of Louisiana (http://ldh.la.gov/Coronavirus/) reports the following prevalence of disease as of April 20, 2020, in the 1,473 Louisiana resident who died of COVID-19:
Hypertension 56.15%
Diabetes 34.73%
Kidney disease 20.11%
Obesity 19.72%
Heart disease 18.56%
Asthma, which is a common chronic disease, was identified in only 3.94% of the Louisiana patients who died.
On April 3, 2020, the Morbidity and Mortality Weekly Report (MMWR) of the CDC released a special report titled “Preliminary Estimates of the Prevalence of Selected Underlying Health Conditions Among Patients with Coronavirus Disease 2019 — United States, February 12–March 28, 2020.” This report is available on-line at http://dx.doi.org/10.15585/mmwr.mm6913e2
The MMWR evaluated data on 7,162 patients and reported: “Approximately one-third of these patients (2,692, 37.6%), had at least one underlying condition or risk factor. Diabetes mellitus (784, 10.9%), chronic lung disease (656, 9.2%), and cardiovascular disease (647, 9.0%) were the most frequently reported conditions among all cases. Among 457 ICU admissions and 1,037 non-ICU hospitalizations, 358 (78%) and 732 (71%), respectively occurred among persons with one or more reported underlying health condition…. the percentage of cases that resulted in an ICU admission was also higher for those with underlying health conditions (13.3%–14.5%) than those without these conditions (2.2%–2.4%).”
Of 457 patients admitted to an ICU whose prior medical history was known, the prevalence of specific diseases was:
Diabetes: 32%
Chronic lung: 21%
Heart disease: 29%
Chronic renal: 9%
Of the 457 patients who required ICU admission only 4 (1%) were pregnant.
On April 9, 2020, Wiley Online Library made available a manuscript accepted to be published in the journal Obesity written by Arthur Simonnet and his colleagues at the Department of Intensive Care of CHU Lille in Lille, France. The article can be downloaded from https://doi.org/10.1002/oby.22831
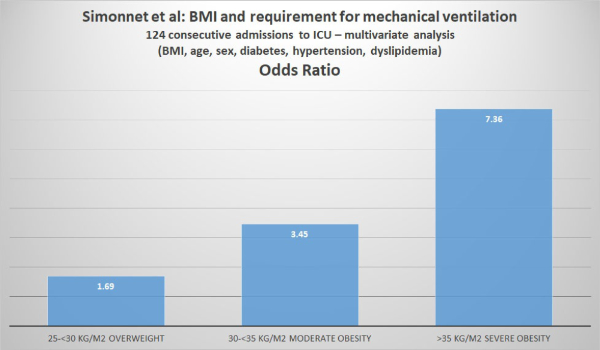
Simonnet et al analyzed the relationship between body mass index (BMI) and the requirement for invasive mechanical ventilation (IMV) in 124 patients consecutively admitted to the ICU of their hospital.
Body Mass Index (BMI) is a person’s weight in kilograms divided by the square of height in meters. The U.S. CDC provides a convenient BMI calculator (inches or kilograms) at https://www.cdc.gov/healthyweight/assessing/bmi/adult_bmi/english_bmi_calculator/bmi_calculator.html
The CDC also provides the following weight classifications based on BMI:
If your BMI is less than 18.5, it falls within the underweight range.
If your BMI is 18.5 to <25, it falls within the normal.
If your BMI is 25.0 to <30, it falls within the overweight range.
If your BMI is 30.0 or higher, it falls within the obese range.
Obesity is frequently subdivided into categories:
Class 1: BMI of 30 to < 35
Class 2: BMI of 35 to < 40
Class 3: BMI of 40 or higher.
Class 3 obesity is sometimes categorized as “extreme” or “severe” obesity. Simonnet et al defined obesity as BMI >30 kg/m2 and severe obesity as BMI >35 kg/m2. Of the 124 patients studied, 47.6% were obese and 28.2% were severely obese. Of the 124 ICU patients, 85 (68.6%) required invasive mechanical ventilation (i.e. they had to be managed using a ventilator). The authors reported that “the need for IMV was significantly associated with male sex (p<0.05) and BMI (p<0.05), independent of age [but the youngest patient was 50], diabetes, and hypertension. The odds ratio for IMV in patients with BMI >35 kg/m2 vs patients with BMI <25 kg/m2 was 7.36 (95% CI 1.63-33.14; p=0.02). The authors concluded: “Importantly, we also showed that the need for IMV, a robust proxy for the severity of SARS-CoV-2, gradually increased with body mass categories, reaching nearly 90% in patients with a BMI > 35 kg/m2.”
