Epidemiological observations COVID-19 as of May 2, 2020
Allan Feingold, MD, FRCP(C), FCCP
Medical Director
Lauren Clancy, RRT, CPFT, MSN, ARNP
Nathan Wasserman
Jordan Couceyro
Occupational & Environmental Medicine
South Miami Hospital
DrIAF@FeingoldMedical.com
305-662-1550
1. On May 1, 2020, Mandeep R. Mehra, MD et al of Brigham and Women’s Hospital Heart and Vascular Center and Harvard Medical School, Boston published a report in the New England Journal of Medicine titled “Cardiovascular Disease, Drug Therapy, and Mortality in Covid-19”. John A. Jarcho MD and a team of biostatisticians of Boston University and Harvard wrote an accompanying editorial.
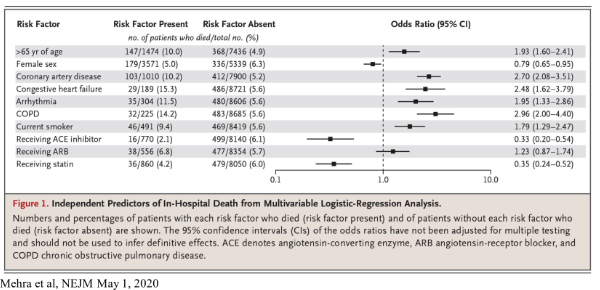
SARS-CoV-2, the virus that causes COVID-19, enters human respiratory tract cells through normal cell surface receptors called angiotensin-converting enzyme 2 (ACE2) receptors. It has been previously shown that the use of ACE inhibitors and angiotensin II receptor blockers (ARB), both commonly prescribed medications for hypertension, increase the expression of ACE2 receptors in rats, which raised concern about the possibility of enhanced viral entry into human cells.
Mehra et al analyzed an observational database that recorded details of 8,910 COVID-19 patients admitted to 169 hospitals in Asia, Europe, and North America between December 20, 2019, and March 15, 2020, including 515 patients who died in hospital (5.8%) and 8,395 who survived to discharge. The authors reported that there was no significant difference in mortality among patients using or not using ARBs, but regarding ACE inhibitors, there was actually a marked reduction in mortality among patients using the inhibitors (2.1% mortality with ACE inhibitors, versus 6.1% without). This difference, which was not observed in prior studies, was statistically significant, with the 95% confidence interval ranging from a 0.2 to a 0.54 odds ratio (where the odds ratio is the chance of dying in someone who uses ACE inhibitor versus the chance of dying in someone who does not use the inhibitor). A potential explanation for this is as follows: while ACE inhibitors lead to the expression of more ACE2 receptors on a cell, the inhibitors may restrict the ability of SARS-CoV-2 to enter the cell by changing the nature of the receptor. Essentially, ACE inhibitors may create “more doors” for SARS-CoV-2 to enter, but they may also lock those doors and leave the virus out.
Mehra also makes observations about the effect of statins on COVID-19 patients and the difference in the female and the male death rate from the disease. The mortality rate in patients who were not receiving statins was 6%, but the mortality rate in patients who were receiving statins was 4.2%. This difference was found to be statistically significant, though the mechanism by which mortality is reduced is not known (and this reduction could be simply a correlation with some yet unidentified factor instead of a causation). Additionally, evidence from Mehra and from other studies that have reported an increased male mortality from COVID-19, raises the possibility that estrogen could be giving females an advantage over males infected with COVID-19. We are skeptical of this argument, however, since the male-female death gap widens with age despite menopause (average age 51). We would expect the opposite result (that the male-female death rate would converge in older age) if estrogen helped reduce mortality. A more plausible explanation, we feel, lies in smoking rates. Men 65 and older in the United States smoke at significantly higher rates than women, a statistic that is also true for men and women of all adult ages. Additionally, Mehra et al, find that being a current smoker roughly doubles risk of dying from COVID-19 (9.4% to 5.6%), a difference that was found to be significant. Combining this data with the consistently found fact that coronary artery disease, a disease found more commonly in males than females and in smokers than non-smokers, roughly doubles mortality rates in COVID-19 patients, suggests that smoking accounts for most, if not all of the male-female gap in COVID-19-associated mortality.
In the editorial which accompanied the paper by Mehra, Jarcho et al noted “Professional scientific societies and experts have spoken with one voice in advising that patients should not discontinue ACE inhibitor or ARB therapy out of a concern that they are at increased risk….” Jarcho also emphasized that the results of the Mehra report may simply be due to unmeasured confounding and, in the absence of a randomized trial, should not be regarded as evidence to prescribe ACE inhibitors or statins to patients suffering from COVID-19; nevertheless, during this era of COVID-19 which may persist until the availability of a vaccine, physicians may wish to consider initiating treatment with statins in their older non-infected patients who may benefit from lipid control anyway. If a mortality advantage with ACE inhibitors is confirmed by further studies, physicians may wish to consider initiating or switching to this class of blood pressure medication for their older patients who need anti-hypertensive therapy.
– Allan Feingold, MD, FRCP(C), FCCP and Nathan Wasserman
2. On April 30, 2020, Kristine A. Moore, MD, MPH and her colleagues of the Center for Infectious Disease Research and Policy (CIDRAP) of the University of Minnesota published a paper titled “The Future of the COVID-19 Pandemic: Lessons Learned from Pandemic Influenza”. The authors refer to prior epidemics and emphasize differences between COVID-19 and influenza. Based on the evolution and eventual resolution of prior epidemics, Moore et al describe the following possibilities:
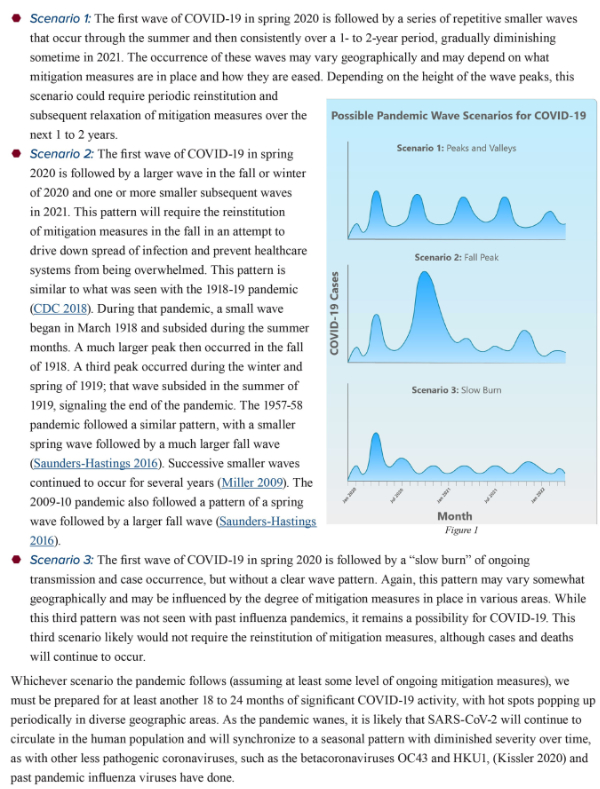
Moore and her associates are saying that despite the effectiveness of the first round of mitigation we will not see the end of the current epidemic for “at least another 18 to 24 months”. Moore and her associates also imply that it will not be possible to achieve effective containment after our current round of mitigation. I agree. Socially disruptive mitigation has been successful. It saved many lives, gave us enough time to better understand the disease process, and to identify those who are at greatest risk. Scientific investigations have been initiated. Multiple different kinds of virus vaccines are under development. Therapeutic trials are underway. But easing of strict mitigation will probably result in significant re-activation of the epidemic which will continue until an effective vaccine is available. In the meantime, young generally healthy people will be able to return to more or less normal life, but people who have chronic illnesses, including obesity, and older Americans will have to continue to take strict measures to prevent exposure to COVID-19.
3. On April 29, 2020, Eli N. Perencevich, MD, MS and colleagues of the University of Iowa, Iowa City published a “Viewpoint” article in the Journal of the American Medical Association which is all the more important because of the possibility of prolonged or recurrent spikes of COVID-19 epidemic predicted by Moore and her colleagues of CIDRAP of the University of Minnesota, presented above. The title of the Perencevich paper is “Moving Personal Protective Equipment Into the Community: Face Shields and Containment of COVID-19.” The authors observe “Experience and evidence, even during this pandemic, suggest that health care workers rarely acquire infections during patient care when proper PPE is used…” Perencevich et al go on to state:
“Face shields offer a number of advantages. While medical masks have limited durability and little potential for reprocessing, face shields can be reused indefinitely and are easily cleaned with soap and water, or common household disinfectants. They are comfortable to wear, protect the portals of viral entry, and reduce the potential for autoinoculation by preventing the wearer from touching their face. People wearing medical masks often have to remove them to communicate with others around them; this is not necessary with face shields. The use of a face shield is also a reminder to maintain social distancing but allows visibility of facial expressions and lip movements for speech perception.
“Most important, face shields appear to significantly reduce the amount of inhalation exposure to influenza virus, another droplet spread respiratory virus. In a simulation study, face shields were shown to reduce immediate viral exposure by 96% when worn by a simulated health care worker within 18 inches of a cough….”
Perencevich et al conclude:
“Face shields, which can be quickly and affordably produced and distributed, should be included as part of strategies to safely and significantly reduce transmission in the community setting. Now is the time for adoption of this practical intervention.”
 Dr. Feingold comments: a Miami based company appears to be making a good but somewhat expensive ($27) face shield. We advocate the use of face shields in general, not necessarily this specific product. This product has the advantage of being manufactured in the U.S. and not in China. Similar face shields are available on Amazon.com.
4. Extreme differences in death rates in different countries, U.S. States, counties, and cities means that no single strategy for the easing of social distancing (and all the other features of mitigation) would be applicable to all areas. Specialized planning for the easing of mitigation should be based at least partially on local death rates, as well as social and geographic differences. There are 67 counties in the State of Florida of which 23 have populations greater than 250,000. The number of deaths and the deaths/100,000 population vary considerably even in the most populous counties. The following table and chart show the deaths /100,000 county population in the most populous 23 Florida counties.
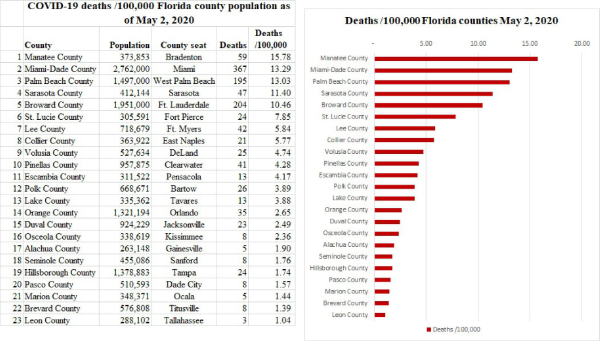
Note the differences in deaths/100,000 for Miami-Dade, Broward, and Palm Beach counties compared to Orange (Orlando), Duval (Jacksonville), and Tampa (all of which have > 1 million residents except for Duval which has >900,000).
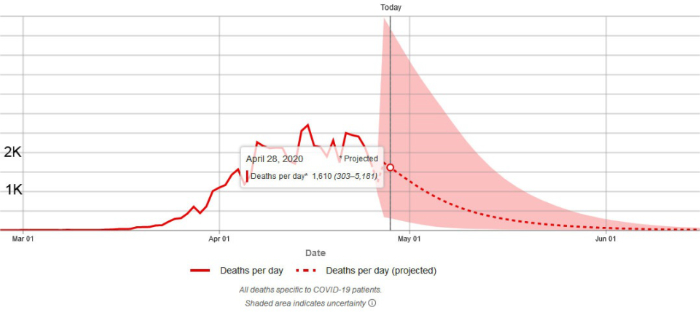
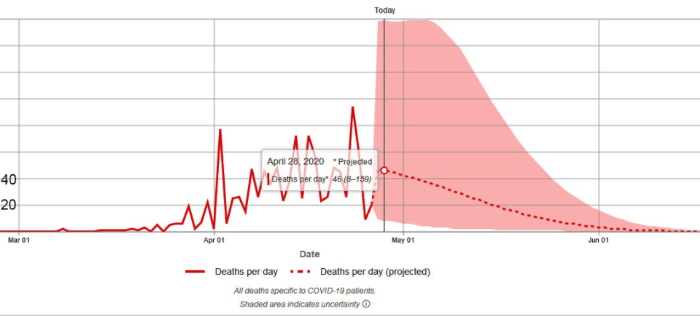
5. On April 28, 2020, the Institute for Health Metrics and Evaluation (IHME) of the University of Washington released the results of the latest run of its revised model which was originally designed to predict hospital bed use, need for intensive care beds and ventilator use due to COVID-19 but also describes the trajectory of the epidemic and predicts the number of epidemic induced deaths. The IHME methodology is explained in a pre-publication paper by the IHME COVID-19 health service utilization forecasting team led by Christopher JL Murray. Dr. Murray is the Chair and Professor of Health Metrics Sciences and Director of the Institute for Health Metrics and Evaluation (IHME) at the University of Washington. A new version of the pre-publication paper was posted April 26, 2020, and can be downloaded from https://doi.org/10.1101/2020.04.21.20074732
An important goal of the IHME model was to predict the peak date of the epidemic (in terms of daily deaths) and the peak requirement for ICU beds and other critical hospital services. The IHME analysis indicated that the peak of the epidemic in Florida occurred on April 23, 2020. On April 28, 2020, the IHME reported that 7 states including Hawaii, Mississippi, Texas, Wyoming, Utah, Nebraska, and North Dakota have not yet experienced the peak of the epidemic.
Also on April 28, 2020, the IHME warned:
… many states [are] experiencing flatter and thus longer epidemic peaks. Further, updated data indicate that daily COVID-19 deaths are not falling very quickly after the peak, leading to longer tails for many states’ epidemic curves. In combination – less abrupt peaks and slower declines in daily COVID-19 deaths following the peak – many places in the US could have higher cumulative deaths from the novel coronavirus.
To access the visualization tool of the IHME model on-line go to https://covid19.healthdata.org/projections
On April 28, 2020, the IHME released the results of the latest run of its model. For the reasons explained above (longer tails) the total predicted deaths for the USA and Florida reported by the newest model run are somewhat higher than those predicted on April 22, 2020. On April 28, 2020, the IHME anticipated that the USA as a whole will see 74,073 deaths by August 4, 2020. On April 30, 2020, the IHME adjusted the total down to 72,433. Both values are up from prior model run prediction of 67,641 but are well within the range of uncertainty. People should not be concerned about small changes in the predicted values. The changes are the result of newly available data and do not indicate instability of the model.
On the other hand, easing of social distancing restrictions, much anticipated and welcome will make modeling more complex and potentially less accurate. On April 30, 2020, the IHME observed:
Increasingly more locations have begun easing or have planned to ease social distancing policies that were previously implemented. Thus far, this includes at least nine states in the US (Alaska, Mississippi, Missouri, Montana, Ohio, Oklahoma, South Dakota, Tennessee, and Vermont)… In addition, some other locations have eased certain parts or a subset of distancing policies (e.g., Georgia, North Dakota, South Carolina, and Texas in the US).
Our present modeling framework does not yet capture how the risk for more COVID-19 cases – and potentially deaths – could increase due to increased interaction among individuals. This is particularly true if locations have not fully instituted strong containment strategies like widely available testing and contact tracing.
It is important to notice that the IHME and many other experts in epidemiology are warning about the possible consequences of failing to achieve adequate contact tracing (not contract tracing, as some in the media report). As discussed further in this report, contact tracing is a traditional public health technique that involves the identification of people who have been in close contact with a person infected with a communicable disease and the quarantine of those contacts who are found to test positive for the disease. Contact tracing is an important component of “containment” which is the organized effort to stop the spread of a disease before it becomes epidemic (in contrast, we are still suffering under “mitigation” which includes techniques such as social isolation which effectively reduce the severity of an epidemic). In the April 30, 2020 statement, the IHME emphasized a new kind of risk associated with inadequate contact tracing, that is, the risk that modeling and all of its benefits, including hospital resource planning, will become less accurate if contact tracing and quarantine of infected contacts is not achieved.
There are two important limitations to contact tracing: cost and privacy. In the past, contact tracing was performed by trained public health interviewers. It can be anticipated that it will be expensive and time-consuming to adequately train a large number of public health workers and it may not be possible to get enough contact tracers ready in the near future. Furthermore, many people are hesitant to name all of their personal contacts. Innovative efforts have been undertaken to automate contact tracing by the use of partially anonymous cell phone apps. The Pew Research Center reports that the great majority of Americans (96%) now own a cell phone, including 91% of those 65 and older, so cell phone contact tracing apps have the potential to be more effective than traditional contact tracing. Hopefully, such apps will become available in time, which in the case of the downward curve of the COVID-19 epidemic in most States, will be by the end of May 2020.
The IHME now anticipates that Florida will see 1,914 deaths by August 4, 2020 (up from prior model run prediction of 1,620 and well within the range of uncertainty).
6. On April 16, 2020 JAMA published a “Viewpoint” article by Nicholas P. Jewell, PhD et al of the Department of Medical Statistics, London School of Hygiene & Tropical Medicine. Jewell et al cautioned against an uncritical use of models and recommended “… the public reporting of estimates from these models, in scientific journals and especially in the media, must be appropriately circumspect and include key caveats to avoid the misinterpretation that these forecasts represent scientific truth.” Jewell et al specifically noted, “Although the Institute of Health Metrics and Evaluation is continuously updating projections as more data become available and they adapt their methods, long-term mortality projections already have shown substantial volatility…” In my opinion, it is precisely because the IHME scientists continuously update their methodology that their model is useful. See http://www.healthdata.org/covid/updates for a discussion of the IHME updating strategy. Jewell et al also commented: “At a time when numbers of cases and deaths from COVID-19 continue to increase with alarming speed, accurate forecasts from mathematical models are increasingly important … Given the unpredictable behavior of severe acute respiratory syndrome coronavirus 2, it is best to acknowledge that short-term projections are the most that can be expected with reasonable accuracy.” The IHME team at the University of Washington is currently releasing major updates on a 3-day schedule.
7. On April 16, 2020 MIT News announced the availability of a pre-publication report of research conducted by scientists of the Department of Civil and Environmental Engineering and the Department of Mechanical Engineering of the Massachusetts Institute of Technology and the Singapore-MIT alliance for research and technology (SMART). The lead scientists are Raj Dandekar, a PhD candidate, and George Barbastathis, professor of mechanical engineering. The paper is titled “Quantifying the effect of quarantine control in Covid-19 infectious spread using machine learning” and is available for download from https://doi.org/10.1101/2020.04.03.20052084 In their paper the authors explain that existing epidemiological models divide populations into the susceptible S, exposed E, infected I and recovered R (SEIR) and calculations are based on the growths and interactions of those groups. The authors further explain “These models cannot capture the large-scale effects of more granular interactions, such as the population’s response to social distancing and quarantine policies.” The model prepared by Dandekar and Barbastathis and their team used machine learning to inform their new model. The mathematics are complex (see the paper); however, the conclusions are not, as shown in figure 10 of the report:
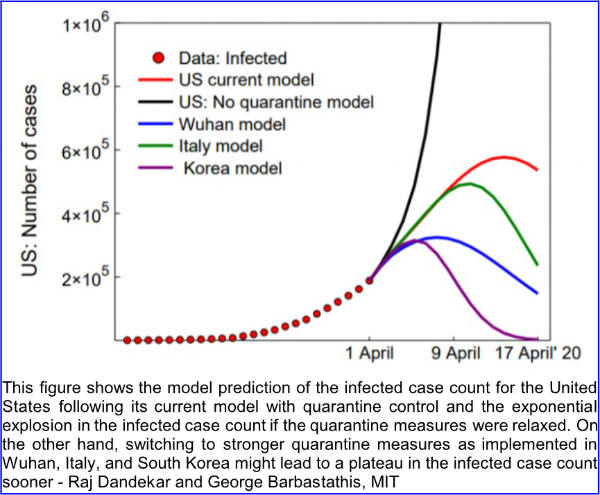
Dandekar and Barbastathis state: “In the case of the US, our model captures well the current infected curve growth and predicts a halting of infection spread by 20 April 2020. We further demonstrate that relaxing or reversing quarantine measures right now will lead to an exponential explosion in the infected case count, thus nullifying the role played by all measures implemented in the US since mid-March 2020.”
8. On April 17, 2020 the Institute for Health Metrics and Evaluation (IHME) provided the following information regarding “When US states could consider easing social distancing if containment measures are in place.” The IHME stated:
Based on our initial estimates, the earliest that some states may be able to ease presently implemented distancing policies – conditional on strong containment measures – appears to be in early to mid-May (lighter greens in the map below). This means, given the current epidemic trajectories and assuming these states have instituted robust containment strategies (e.g., widely available testing, contact tracing, and case-based isolation, restricting mass gatherings), states including Alaska, Hawaii, Idaho, Montana, New Hampshire, North Carolina, Vermont, and West Virginia could potentially fall below 1 prevalent case of COVID-19 per 1,000,000 (1 million) around the first or second week of May.
These initial projections suggest states with among the highest total COVID-19 deaths to date – including New York, New Jersey, and Connecticut – may be able to safely consider easing their currently enacted distancing policies, conditional on implementing strong containment strategies, as early as late May or early June. Other states, such as Louisiana, Michigan, and Washington, may fall below the 1 prevalent infection per 1,000,000 threshold around mid-May.
Based on current trajectories, 15 states may need to wait until June 8 or even beyond that time before they fall below the 1 prevalent infection per 1,000,000 threshold. These projections could change as new data become available and/or different policies are implemented.
9. On April 21, 2020 the IHME stated:
Today’s release involves the second iteration of projecting when states may be able to consider easing currently implemented social distancing policies – if and only if – strong containment measures already have been instituted. Based on the latest available data and updated predictions of COVID-19 prevalence, the table below outlines potential timing of these considerations.
Estimates from today’s release suggest that 30 states may fall below the 1 prevalent case per 1,000,000 threshold during May (greens to the light yellow in the map below). As further detailed in the April 17 update, this threshold is considered a conservative estimate of the number of COVID-19 infections that states could reasonably identify via active case detection and contact tracing.
Another threshold suggested by the IHME is 0.3 daily deaths per million; however, they originally used this threshold as the curve of the epidemic rose in different States, because it represented a point after which data was stable. The threshold of 0.3 deaths per million may not be statistically stable on the way down. As far as risk to citizens is concerned, I think 0.3 deaths per million is a low although arbitrary number. In Florida it amounts to 6.6 deaths per day. According to the current IHME projections 7 people will die per day on May 26, and May 27, 2020.
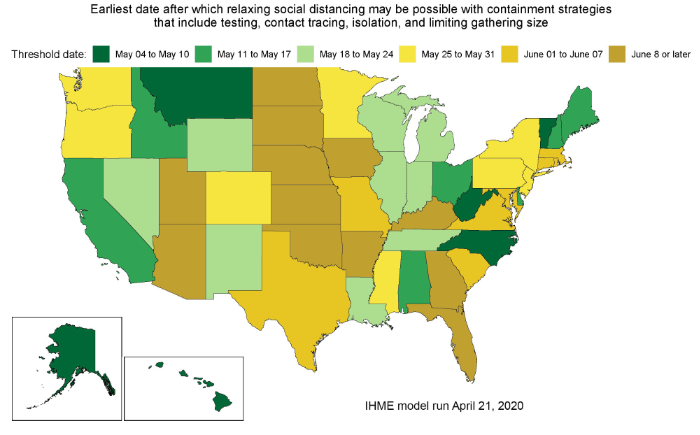
Current trajectories indicate that 12 states may need to wait until at least June 8 or beyond that time before they fall below the 1 prevalent infection per 1,000,000 threshold. These projections could change as new data become available or different policies are implemented.
Results from today’s release indicate these projected “threshold” dates are, on average, later than those released on April 17. Arizona, Florida, Kansas, and North Dakota had the largest shifts to later dates. The main driver of these later predictions is the increase in reported deaths since the last release, as well as predictions of longer (and flatter) epidemic peaks for several states.
On April 22, 2020 the IHME estimated that Florida could consider easing social distancing (mitigation) and shifting to containment strategies by June 14, 2020. On April 28, 2020 the IHME observed: “a number of EEA countries and US states have begun to ease at least some of their currently implemented social distancing measures. We are now actively modifying our present modeling framework in order to better capture the potential effects of easing these measures given current and near-term estimates of testing capacities and COVID-19 burden.”
10. Very high mortality reported in kidney transplant patients infected with COVID-19: On April 24, 2020 Akalin et al of the Montefiore Medical Center, Bronx, NY reported in the New England Journal of Medicine observations regarding 36 consecutive adult kidney-transplant recipients who tested positive for Covid-19 between March 16 and April 1, 2020. The authors reported “At a median follow-up of 21 days (range, 14 to 28), 10 of the 36 kidney-transplant recipients (28%) and 7 of the 11 patients who were intubated (64%) had died. Two of the 8 patients who were monitored as outpatients died at home.” Not surprisingly, kidney transplant is an important risk multiplier for COVID-19 disease and kidney transplant patients should be advised to take extreme measures to prevent contact with individuals who may have symptomatic or asymptomatic COVID-19.
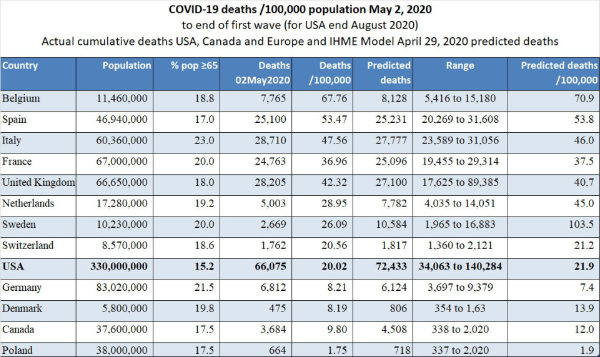
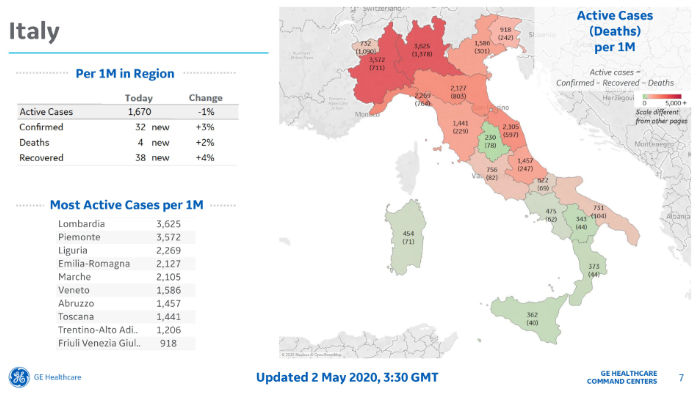
11. Extreme differences in death rates: Today’s spreadsheet shows that Italy has the largest number of COVID-19 deaths in Europe and the third highest (after Belgium and Spain) number of deaths per 100,000 population at 47.56 (compare to USA at 20.02 and Canada at 9.8).
The region of Lombardy (capital Milan) has experienced a large number of deaths and currently has a cumulative death rate of 138/100,000.
GE Healthcare Partners provides a daily COVID-19 report which includes international data. Note that the GE Healthcare web site reports cases and deaths per million inhabitants. To obtain an equivalent value per 100,000 population simply divide by 10. See the case (death) maps below:
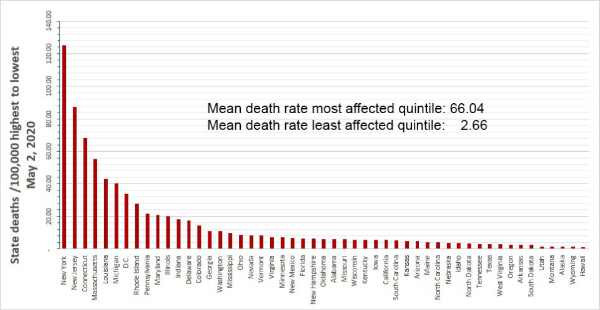
As in Italy, with its markedly different death rates per region, in the United States, we observe markedly different death rates per State as shown in the table we prepared (below) and the map prepared by GE Healthcare shown on the next page.
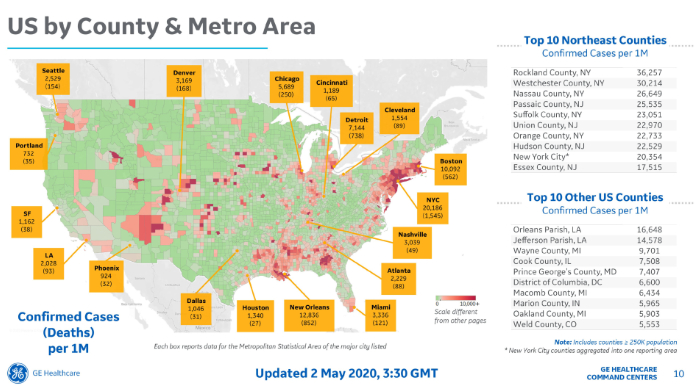
Now consider the death rate in New York City which today we calculate as 114/100,000 (New York City has reported deaths in more than one way) compared to the Miami COVID-19 death rate which today was 13.3. Some age-specific data for New York City and Florida is available as follows:
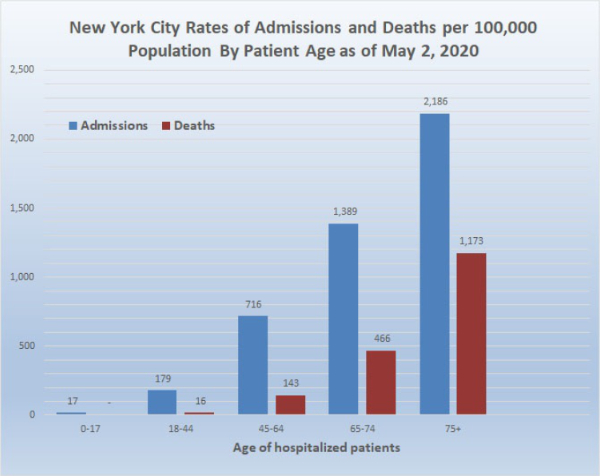
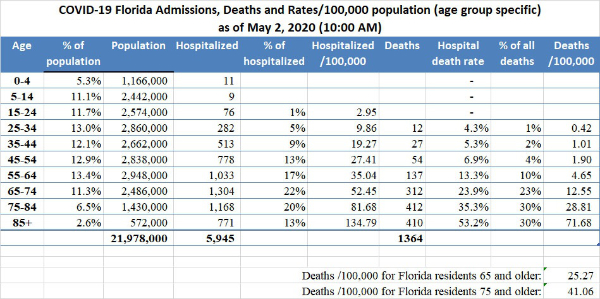
Data provided by the New York City DOH (as shown in the graph above) indicates that as of May 2, 2020, 1.2% (1,173/100,000) of the population of New York City 75 years old and above has died of COVID-19. In comparison, the Florida DOH reported that as of May 2, 2020, the cumulative COVID-19 death rate in Florida of people 75 and above is 41/100,000. That is, the death rate of New York City residents 75 and older is 29 times greater than the death rate of Florida residents 75 and older. Epidemiologists and other scientists around the world have embarked upon a search for the causes of these extreme differences in death rates. It is anticipated that elucidating the causes of these differences will aid in the understanding of the pathophysiology of COVID-19. In addition, the marked differences in death rates in different countries, states, and counties means that no single strategy for the easing of social distancing and all the other features of mitigation would be applicable to all areas. Specialized planning for the easing of mitigation should be based at least partially on local death rates, as well as social and geographic differences.
12. New York City high hospital mortality: On April 22, 2020, the Journal of the American Medical Association published a report by Safiya Richardson, MD, MPH, and her colleagues of the Institute of Health Innovations and Outcomes Research, Feinstein Institutes for Medical Research in New York City. The report describes 5,700 sequentially hospitalized patients admitted to 12 Northwell Health system hospitals in New York, Long Island, and Westchester County during the period March 1, 2020, and April 4, 2020. Of those 5,700 patients, 2,634 patients were discharged or had died during hospitalization at the study endpoint. Richardson et al reported significant findings:
Among the 2,634 patients who were discharged or had died at the study endpoint, during hospitalization, 373 (14.2%) were treated in the ICU, 320 (12.2%) received invasive mechanical ventilation, 81 (3.2%) were treated with kidney replacement therapy, and 553 (21%) died. Mortality for those who received mechanical ventilation was 88.1% (n = 282). Mortality rates for those who received mechanical ventilation in the 18-to-65 and older-than-65 age groups were 76.4% and 97.2%, respectively. Mortality rates for those in the 18-to-65 and older-than-65 age groups who did not receive mechanical ventilation were 19.8% and 26.6%, respectively.
Co-morbidities at the time of admission were commonly detected. Of 4,170 patients whose BMI could be calculated, 1,737 (41.7%) were obese (BMI >30) and an additional 791 (19.0%) were morbidly obese (BMI >35) for a total of 61% obesity. The New York State Community Health Indicator reports that the age-adjusted percentage of adults with obesity (BMI >30) in New York City is 22.9% and therefore, consistent with other reports in the literature, including the paper from France by Simonnet et al which I reviewed yesterday (see below), obesity appears to be a risk multiplier of COVID-19. Richardson et al indicated that hypertension and diabetes were also commonly identified among the 5,700 patients admitted to New York hospitals.
The Richardson paper in JAMA presented its data by means of limited tables. I prepared a more robust presentation of the data as shown below:
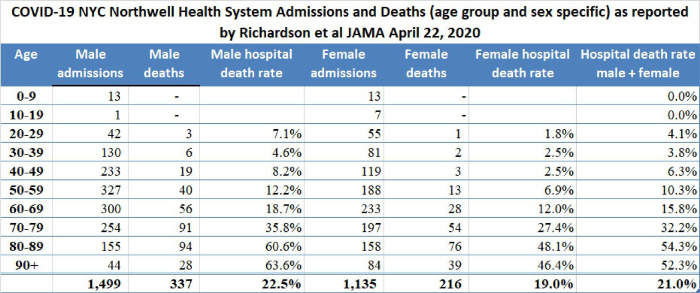
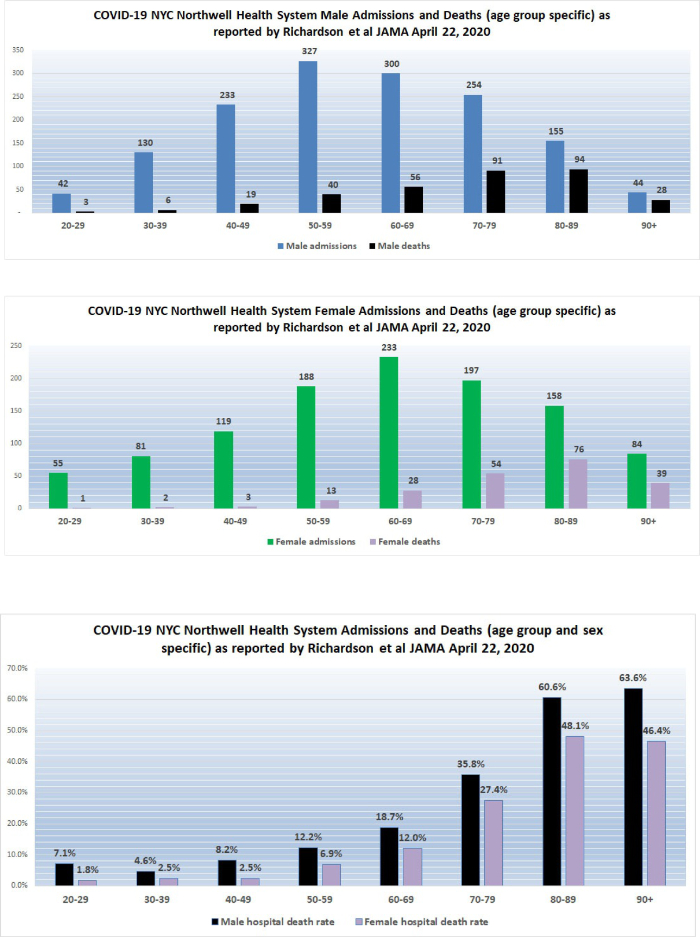
The high death rates for men and women 60 years of age and older admitted to the 12 hospitals in New York is cause for concern. We do not yet have detailed data from similar Florida hospital systems with which to compare the numbers reported by Richardson but anecdotal reports from South Florida ICU doctors describe lower death rates than those reported by Richardson for hospitalized patients in general, and much lower death rates for patients managed by invasive mechanical ventilation (IMV); however, only when detailed data from hospital systems in Florida and other states become available will it be possible to determine whether or not what occurred in New York City hospitals was actually unique.
On April 12, 2020, I wrote “New York State currently has 23 times more deaths per 100,000 population than does Florida. New York City reports a death rate of 71 per 100,000 NYC residents compared to the current death rate reported from Miami-Dade of 3.51 per 100,000 Miami-Dade residents. New York City currently has 20 times more deaths per 100,000 population than does Miami-Dade … If the quality of hospital care is approximately the same in Florida and New York, New York State should have 20 times the number of cases of COVID-19 as does Florida; however, the actual multiplier is much less at 10.7 times more confirmed cases per 100,000 population. There are several possible explanations for this observation… [one] possibility is that the case fatality rate in New York State, especially in New York City, is currently much worse than the case fatality rate in Florida. Patients who die of COVID-19 (usually older than 65 and/or who suffer from significant chronic illness) reportedly succumb to overwhelming pneumonia, septic shock and sequential organ failure. Those conditions are very difficult to treat and even one or two cases represent a significant burden on an ICU well staffed with experienced pulmonologists, respiratory therapists and ICU nurses. It is probable that even if they have enough beds and ventilators, the ICU staff in New York hospitals are overwhelmed.” Richardson and her colleagues report extreme mortality rates in men older than 60 and a mortality of 88.1% in ventilated patients.
13. Epidemiological aspects of testing: At the end of March 2020, the FDA issued an emergency use authorization (EUA) for a new analyzer produced by Abbott Labs (ID NOW COVID-19). This device, which is about the size of a toaster, is expected to be used at the “point of care”, i.e. at the bedside inpatient care settings. The device detects specific nucleic acid from the RNA of the COVID-19 virus within about 5 minutes. The Abbott machine is being rapidly deployed to hospitals. At first, the test will be used primarily to confirm the diagnosis of COVID-19 in hospital emergency rooms. An even more important use will be for the determination of the presence or absence of COVID-19 in the respiratory secretions of health care providers who are either quarantined because of a supposed contact or are recovering from the disease and need to get back to the front lines of hospitals, including ICUs. A second kind of test is a blood test to detect COVID-19 specific antibodies. In response to a viral infection, the body produces at least 2 kinds of antibodies which are immune chemicals capable of attacking outside invaders. The first type of antibody produced by the body during the early phase of infection is an IgM and the second kind of antibody which is produced during recovery and which contributes to long-lasting immunity is an IgG. Antibody tests will be valuable for at least 3 reasons: firstly, the determination of anti-COVID-19 IgG antibodies in the serum of health care workers who have recovered from COVID-19 infection will identify most (about 80%) of those workers as immune and able to treat COVID-19 patients with less risk, and possibly even without personal protective equipment (PPE); secondly, the identification of elevated levels of IgG in individuals who have recovered from COVID-19 identifies those people as potential blood donors. Anti-COVID-19 antibodies from the blood of such donors can be used to treat other patients who have severe COVID-19 infection; thirdly, the determination of IgG antibodies in large sample populations will make it possible to calculate the overall prevalence of the disease in the population, despite the fact that many who have the disease are asymptomatic.
On April 15, 2020, Abbott announced the availability, starting on April 16, 2020 of its new IgG antibody test “which will initially be available on its ARCHITECT® i1000SR and i2000SR laboratory instruments. More than 2,000 of these instruments are in use in U.S. laboratories.” Abbott plans to ship 1 million test kits for the detection of IgG in the first week and 4 million by the end of April 2020. Abbott also announced that it is “ramping up to 20 million tests in the U.S. in June and beyond as it expands the tests to run on its new Alinity™ I system. Abbott also will be expanding its laboratory antibody testing to the detection of the antibody, IgM, in the near future.”
14. “Testing, testing, testing”. For reasons entirely unclear to me, many have been insisting that somehow “testing” will stop the COVID-19 epidemic. It is worthwhile to consider testing in terms of technology, strategy (for example as part of contact tracing), and epidemiology. Quick, easy, painless, and accurate testing will be an important feature of contact tracing which will be necessary in order to avoid recurrent epidemics once social distancing has been eased. Targeted testing of populations at risk or special populations who represent a risk to others will be valuable. Additionally, testing of sample populations will help to establish prevalence and levels of immunity; however, mass testing of populations with a low prevalence of disease will probably be of little value.
As a result of the COVID-19 epidemic many Americans have suddenly developed an interest in epidemiology. Statistical and epidemiological terms are used frequently by the media. It is a good idea to define some of the terms being used so frequently:
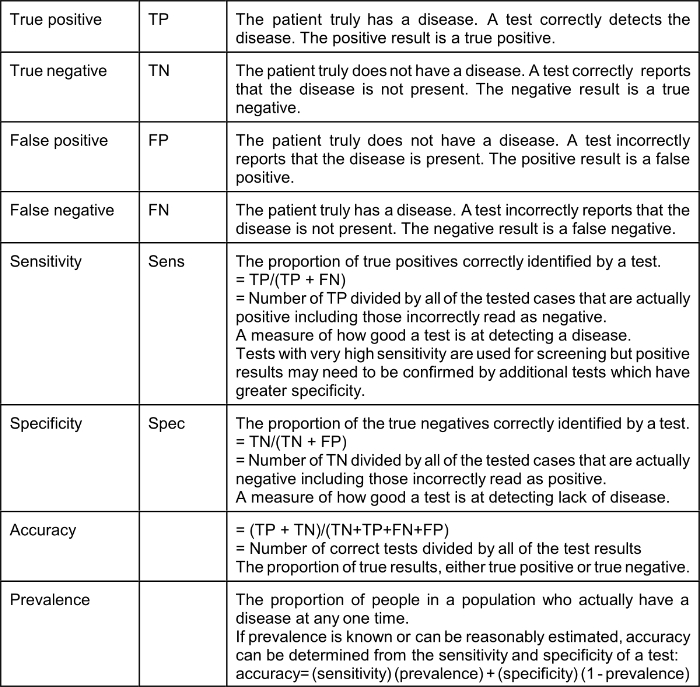
The effect of a low prevalence of a disease on the value of positive test results (“Positive Predictive Value” or PPV) is explained by Bayes’ Theorem (Thomas Bayes, 1701–1761), the complicated math of which many of us struggled with in medical school. Bayes Theorem explains that in a situation where the “pre-test probability” (actual prevalence) is low, a positive result produced even by a test with very good sensitivity and specificity is not of much value. It should be intuitively obvious that a test that reads positive on a sample from a person who comes from a population where the condition or disease does not exist is a false positive; for example, a positive pregnancy test done on urine from a man is necessarily a false positive. Therefore, the Positive Predictive Value (PPV), which is the probability that the disease or condition is present when the test is positive, is low (in the example, zero).
PPV = sensitivity x prevalence / (sensitivity x prevalence) + (1-specificity) x (1-prevalence)
Using a very good test characterized by a sensitivity of 90% (10% false negative) and specificity of 93% (7% false positive): if the actual prevalence of a disease in the population from which the tested patient comes is 5% (a high number for COVID-19 in many communities) the Positive Predictive Value of a positive test is only 40%.* If the prevalence is 3% the Positive Predictive Value of a positive test is only 28%. It should be understood that Bayes’ Theorem applies to any kind of a test, including nasal swab tests and blood tests.
*https://www.medcalc.org/calc/diagnostic_test.php
Unless your patient most likely has COVID-19 (i.e. pre-test probability is high), or just came from NYC (i.e. from a place where prevalence is high), a positive result is unlikely to be correct, even if the test was not manufactured in China. “Clearing” a health care worker who had COVID-19 to go back to work, or determining if a college student who had COVID-19 can visit his grandparents by using a nasal swab nucleic acid test is an entirely different matter. In those cases, the pre-test probability is likely high, depending on how long after the onset of recovery the swab is taken. If the swab is taken too soon after recovery when persistent viral shedding is probable (but not certain), the pre-test probability is very high (perhaps 50%) and therefore, the Positive Predictive Value of a positive test is high. Furthermore, the false-negative rate of a nasal swab nucleic acid test is low. Therefore, if the test is positive, the health care worker does not yet go back to work and should be re-tested in a few days. If the test is negative, it is probably correct, but should be repeated before the health care worker has contact with patients. The same logic applies to the college student recovering from COVID-19 who wants to visit his grandparents.
The current COVID-19 epidemic will be suppressed by aggressive mitigation and, in some places like New York City where there was widespread infection, the development of herd immunity. The availability of new quick and accurate testing methods will be of benefit in the control of future disease “spikes” which can be anticipated to occur after social distancing is relaxed and until an effective vaccine is available. Testing will be useful for the early detection of new disease activity, especially disease “hot spots” and for contact tracing, a traditional public health technique which involves the identification of all the contacts of an infected person and the quarantine of those contacts who are found to test positive. On April 17, 2020 JAMA published online a “Viewpoint” article by infectious disease specialists Walensky and del Rio of Harvard Medical School and Emory University School of Medicine titled “From Mitigation to Containment of the COVID-19 Pandemic Putting.” The authors emphasized the importance of testing strategies to be applied after the current acute phase of the COVID-19 epidemic has ended. Walensky and del Rio state:
The cornerstone of the next phase will require massive testing, in 2 forms. First, serologic testing that detects immunoglobulins (IgM and IgG) specific for SARSCoV- 2 will provide estimates of population exposure. Because a significant number of individuals with COVID-19 are asymptomatic or mildly symptomatic, the population fraction that has been infected remains unknown. It must be presumed (and hoped) that prior exposure provides some protection, at least long enough to bridge to a vaccine. With an estimated reproduction number (R0) of 2 to 3, the benefits of herd immunity will occur when 50% to 66%of the population has already been infected, whether or not symptomatic. These population estimates could help guide the necessary level of vigilance and intervention.
In contrast to COVID-19, the R0 of measles is approximately 18. In order to stop or prevent an epidemic of measles, herd immunity of >90% must be achieved, much preferably by vaccination. Walensky and del Rio go on to explain:
Second, virologic polymerase chain reaction testing that detects active disease is important to effectively stop transmission…. because asymptomatic and presymptomatic transmission is important, additional wide-scale intermittent testing (eg, weekly) of asymptomatic persons also may be required, particularly for individuals with significant exposure to others, such as athletes, teachers, service industry employees (eg, in retail and maintenance), and health care workers.
… testing alone is insufficient. Vital to any screening program is the action taken when a test result is positive. People identified with COVID-19 must be immediately informed, educated, isolated, and then their contacts efficiently identified, all in a manner sensitive to individual needs. Modeling studies suggest that to achieve effective control, contacts must be quarantined within 24 hours…
The reader should understand that in the context of epidemiology “containment” means a coordinated program of large scale testing for the detection of acute disease (e.g. analysis of nasal swab by the Abbott ID NOW COVID-19) and prompt contact tracing and quarantine of positive contacts. As explained further above, such containment will have to be applied once the nation returns to normal status in order to prevent recurrent “spikes” or even recurrent epidemics. If a disease escapes containment, mitigation is necessary. Mitigation relies on non-pharmaceutical interventions such as hand hygiene, travel restrictions, school and business closures and social distancing which are inconvenient, socially, and economically harmful and highly effective.
15. Underlying serious health conditions increase the risk of a severe outcome in COVID-19: The explanation for the markedly increased susceptibility of older people to this virus is still not available. One explanation that has been proposed is that with increasing age many people accumulate chronic illnesses such as obesity, hypertension, and type II diabetes which are normally manageable and not immediately threatening but which may decrease the potency of a person’s natural defenses. The Chicago Department of Health reports that as of April 21, 2020, it had identified 13,612 cases of COVID-19 and 593 deaths. Of 560 patients who died and whose medical history was available, 519 or 92.7% had at least one known chronic medical condition, most commonly diabetes, hypertension, and lung disease. See https://www.chicago.gov/city/en/sites/covid-19/home/latest-data.html
The Department of Health of Louisiana (http://ldh.la.gov/Coronavirus/) reports the following prevalence of disease as of April 20, 2020, in the 1,473 Louisiana resident who died of COVID-19:
Hypertension 56.15%
Diabetes 34.73%
Kidney disease 20.11%
Obesity 19.72%
Heart disease 18.56%
Asthma, which is a common chronic disease, was identified in only 3.94% of the Louisiana patients who died.
On April 3, 2020, the Morbidity and Mortality Weekly Report (MMWR) of the CDC released a special report titled “Preliminary Estimates of the Prevalence of Selected Underlying Health Conditions Among Patients with Coronavirus Disease 2019 — United States, February 12–March 28, 2020.” This report is available on-line at http://dx.doi.org/10.15585/mmwr.mm6913e2
The MMWR evaluated data on 7,162 patients and reported: “Approximately one-third of these patients (2,692, 37.6%), had at least one underlying condition or risk factor. Diabetes mellitus (784, 10.9%), chronic lung disease (656, 9.2%), and cardiovascular disease (647, 9.0%) were the most frequently reported conditions among all cases. Among 457 ICU admissions and 1,037 non-ICU hospitalizations, 358 (78%) and 732 (71%), respectively occurred among persons with one or more reported underlying health condition…. the percentage of cases that resulted in an ICU admission was also higher for those with underlying health conditions (13.3%–14.5%) than those without these conditions (2.2%–2.4%).”
Of 457 patients admitted to an ICU whose prior medical history was known, the prevalence of specific diseases was:
Diabetes: 32%
Chronic lung: 21%
Heart disease: 29%
Chronic renal: 9%
Of the 457 patients who required ICU admission only 4 (1%) were pregnant.
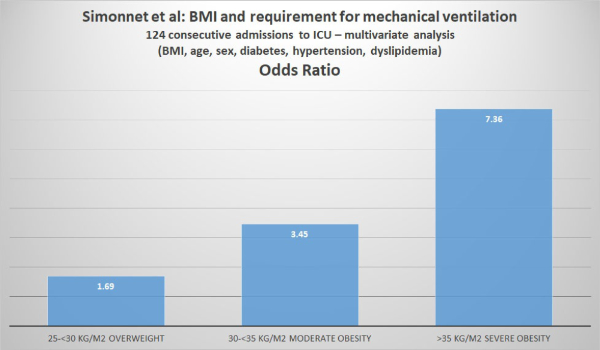
On April 9, 2020, Wiley Online Library made available a manuscript accepted to be published in the journal Obesity written by Arthur Simonnet and his colleagues at the Department of Intensive Care of CHU Lille in Lille, France. The article can be downloaded from https://doi.org/10.1002/oby.22831
Simonnet et al analyzed the relationship between body mass index (BMI) and the requirement for invasive mechanical ventilation (IMV) in 124 patients consecutively admitted to the ICU of their hospital.
Body Mass Index (BMI) is a person’s weight in kilograms divided by the square of height in meters. The U.S. CDC provides a convenient BMI calculator (inches or kilograms) at https://www.cdc.gov/healthyweight/assessing/bmi/adult_bmi/english_bmi_calculator/bmi_calculator.html
The CDC also provides the following weight classifications based on BMI:
If your BMI is less than 18.5, it falls within the underweight range.
If your BMI is 18.5 to <25, it falls within the normal.
If your BMI is 25.0 to <30, it falls within the overweight range.
If your BMI is 30.0 or higher, it falls within the obese range.
Obesity is frequently subdivided into categories:
Class 1: BMI of 30 to < 35
Class 2: BMI of 35 to < 40
Class 3: BMI of 40 or higher.
Class 3 obesity is sometimes categorized as “extreme” or “severe” obesity. Simonnet et al defined obesity as BMI >30 kg/m2 and severe obesity as BMI >35 kg/m2. Of the 124 patients studied, 47.6% were obese and 28.2% were severely obese. Of the 124 ICU patients, 85 (68.6%) required invasive mechanical ventilation (i.e. they had to be managed using a ventilator). The authors reported that “the need for IMV was significantly associated with male sex (p<0.05) and BMI (p<0.05), independent of age [but the youngest patient was 50], diabetes, and hypertension. The odds ratio for IMV in patients with BMI >35 kg/m2 vs patients with BMI <25 kg/m2 was 7.36 (95% CI 1.63-33.14; p=0.02). The authors concluded: “Importantly, we also showed that the need for IMV, a robust proxy for the severity of SARS-CoV-2, gradually increased with body mass categories, reaching nearly 90% in patients with a BMI > 35 kg/m2.”
16. Pediatric cases are uncommon, often (68%) asymptomatic and a large proportion were detected in New York: On April 6, 2020, the Morbidity and Mortality Weekly Report (MMWR) of the CDC released a special report titled “Coronavirus Disease 2019 in Children — United States, February 12–April 2, 2020. MMWR Morb Mortal Wkly Rep 2020;69:422–426.” This report is available on-line at http://dx.doi.org/10.15585/mmwr.mm6914e4 and its main points were summarized on April 8, 2020, by Dr. Deborah Lehman of the NEJM: “Researchers examined almost 150,000 laboratory-confirmed cases of COVID-19 between February 12 and April 2. Of these, 2572 (1.7%) were <18 years old, and 33% of pediatric cases were from New York City. For cases with available information, findings include:
a. Median age was 11 years (range, >1 to 17 years).
b. 73% of children had the classic COVID-19 symptoms (fever [56%], cough [54%], shortness of breath [13%]) versus 93% of adults.
c. Other symptoms noted in children included sore throat (24%), headache (28%), and myalgias (23%), all at lower frequencies than reported in adults.
d. Hospitalizations were lower for children (5.7%) than for adults aged 18 to 64 years (10%), including fewer intensive care unit admissions.
e. 68% of children had no symptoms (there was incomplete symptom reporting).
f. 23% of children had an underlying condition, including asthma, immunosuppression, and cardiovascular disease.”
Notes:
1. Values in columns above which show theoretical number of cases, prevalence, and mortality at “x10” estimate that the real number of cases is 10x greater than the reported number of test-proven cases. The actual number of cases is probably between 10 and 100 times greater than the number of test-proven cases. Mortality rates are calculated by dividing the number of deaths by the number of confirmed (tested) cases which are mostly severe or moderately severe cases. It is too early to estimate the mortality of hospitalized patients. Verity et al reported in Lancet Infect Dis (https://doi.org/10.1016/S1473-3099(20)30243-7): mean duration from onset of symptoms to death 17.8 days; also “In all laboratory-confirmed and clinically diagnosed cases from mainland China (n=70,117)… we obtained a best estimate of the case fatality ratio in China of 1.38% (1.23-1.53), with substantially higher ratios in older age groups…”
2. For context: CDC reports that in 2017 total of U.S. deaths from all causes was 2,813,503.
3. Compare to influenza. United States CDC reports:
2018-2019 influenza: 35,520,883 cases, 490,561 hospitalizations and 34,157 deaths. Overall mortality of 34,157/35,520,883 = .1% and hospital mortality 34,157/490,561 = 7%
2017-2018 influenza: 45,000,000 cases,810,000 hospitalizations and 61,000 deaths. Overall mortality of 61,000/45,000,000 = .14% and hospital mortality 61,000/810,000 = 7.5%